
A past week of Amsterdam’s traffic renders as extruded hexagons clipped to the city boundary, coloured by congestion level.
geocodeOnethengeometryDataturn a city name into the administrative polygon the analytics query wants, so the area is not yours to draw.trafficAreaAnalyticstakes that polygon, a date range and a metric list, and returns one cell grid covering all of them.TrafficAreaAnalyticsModule.showtakes that response unchanged. The grid, the extrusion and the colour ramp come with the module.
Related examples
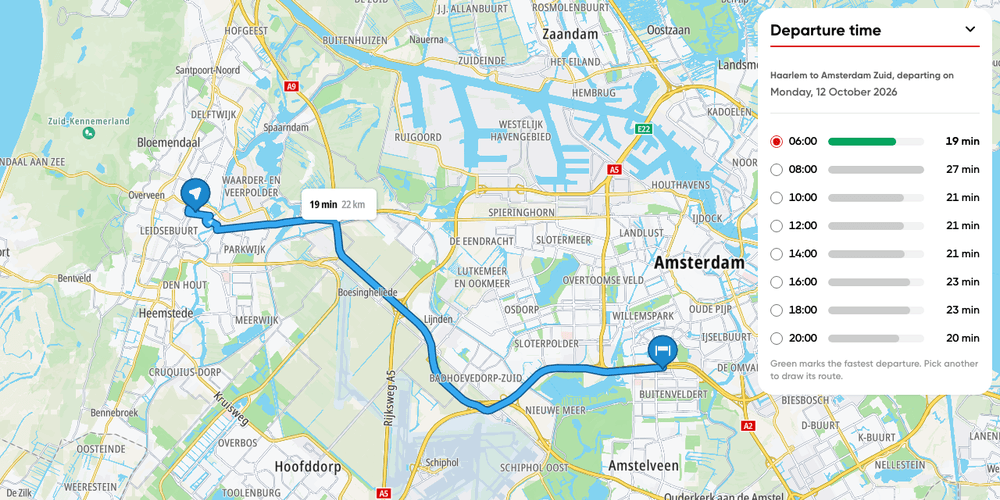
Route departure time
Plan one trip into Amsterdam for departures across the next weekday and pick the fastest.
Getting Started
Routing
Traffic
Web

Route with traffic monitoring
Dynamic route recalculation with live traffic updates
Getting Started
Routing
Traffic
Web

Traffic flow map
Display a traffic flow map
Getting Started
Traffic
Web

Traffic incidents map
Display a traffic incidents map
Getting Started
Traffic
Web