
Bring Your Own Data: Median Price per Hexagon
Colour a city by the median asking price per square metre in each hexagon, aggregated from your own listings and drawn with the CustomGeoJSONModule.
Five thousand listings turn into a map of where Berlin is expensive, each cell coloured by the median price of the listings inside it.
aggregateIntoCellsgives each hexagon or square itsmedian,meanandcount, so a cell of a few pricey flats colours as strongly as one of many cheap ones.minCountleaves cells of fewer than five listings empty.- The cells are plain polygons with the statistics as properties, so
CustomGeoJSONModulecolours them by['get', 'median']. - A new cell size is one more
aggregateIntoCellscall, andgridOriginkeeps the cells in place.
Related examples
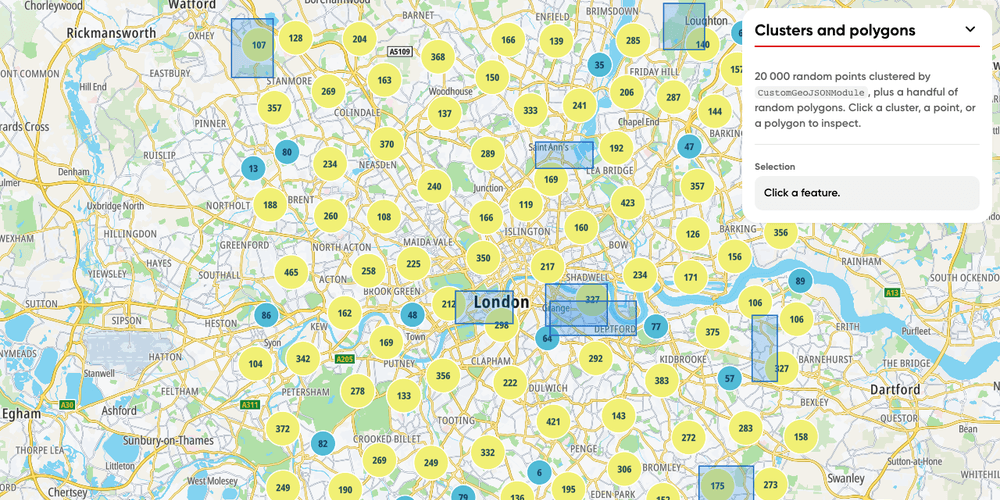
Bring Your Own Data: Clusters and Polygons
20k clustered random points and random polygons around London, rendered with the CustomGeoJSONModule. Both layers are clickable.
Customization
Bring Your Own Data
User Interaction Events
Web

Bring Your Own Data: GeoJSON Heatmap with Custom Module
Render a custom GeoJSON heatmap and labeled symbol layer with the CustomGeoJSONModule, with style-change restore, hover and click events.
Customization
Bring Your Own Data
User Interaction Events
Web
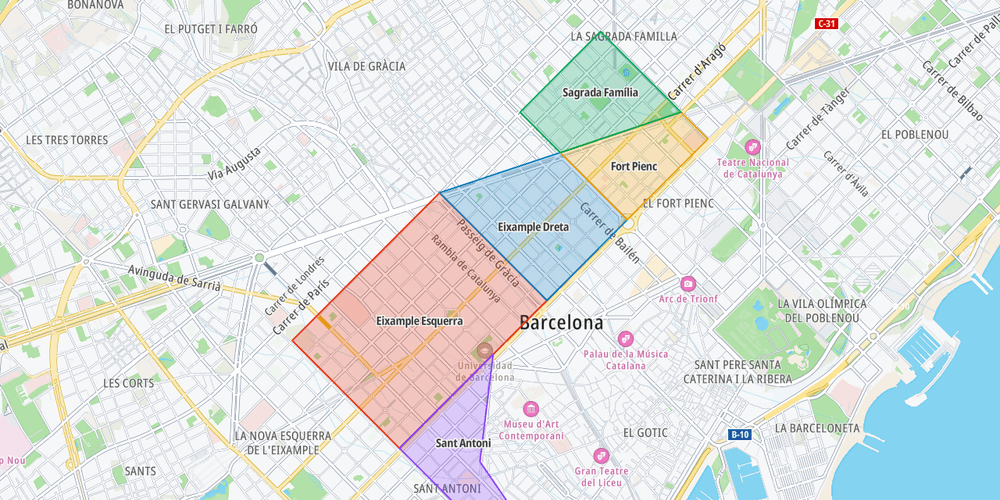
Delivery zones of your own
Show your own GeoJSON polygons and respond to clicks on them
Customization
Bring Your Own Data
Geometry
User Interaction Events
Web

Add Stops to Route (Playground)
Dynamically add and remove intermediate stops on a route by clicking the map
Playground
Routing
Utilities
User Interaction Events
Web