Viewing analysis results
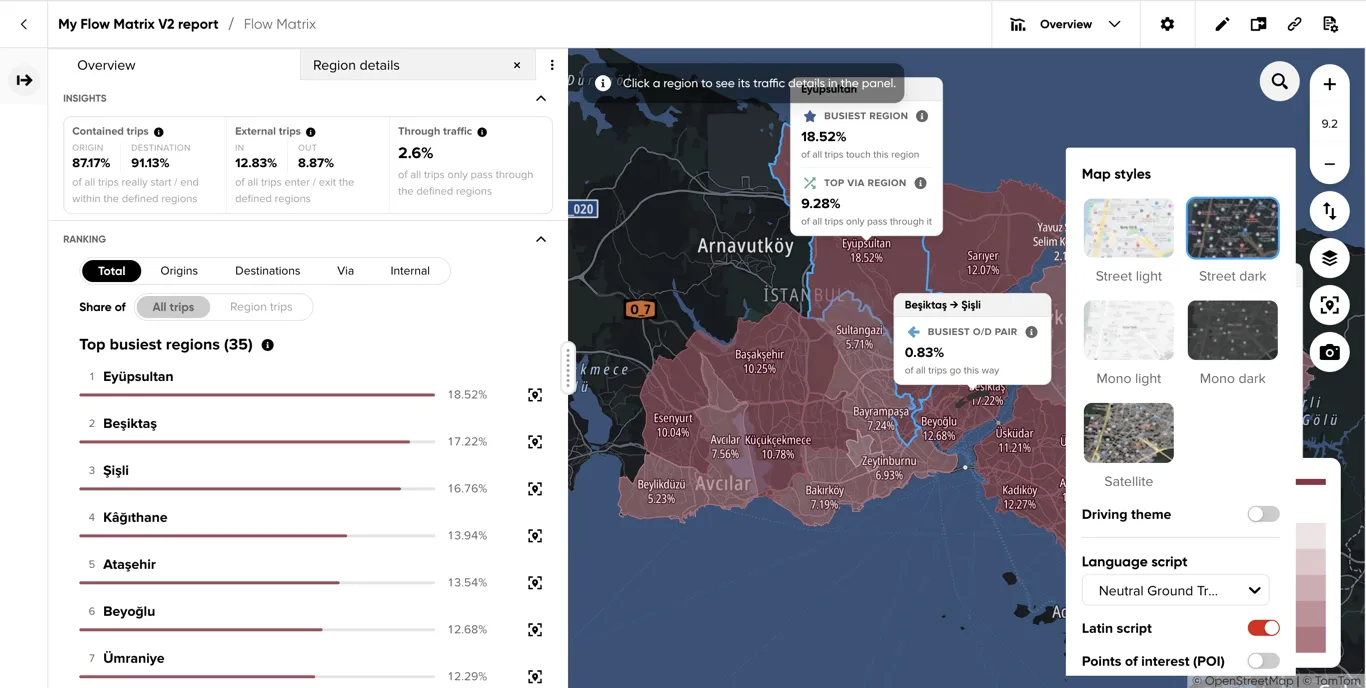
Accepted Flow Matrix reports open in a results workspace shared by the Overview, Matrix, and Flows Explorer visualizations.
Page layout
The workspace consists of:
- A top bar for navigation, report information, and report actions.
- A left panel for selecting the result period and configuring the current visualization.
- A map area for exploring the spatial results.
- A results panel for tables, charts, and detailed information.
The contents of these areas vary by visualization. See Overview, Matrix, or Flows Explorer for their result-specific controls and interactions.
Top bar
The chevron on the left returns to the dashboard. It is followed by the report name and analysis type. The right side contains the actions available for the current report and visualization.

Visualization type
Switches between Overview, Matrix, and Flows Explorer. See Visualization type for details.
Layer settings
The available map-layer options depend on the visualization. See Layer settings for Overview, Matrix, and Flows Explorer.
Downloads
Download formats and scopes depend on the visualization. See Download results for Matrix and Flows Explorer.
Rename report
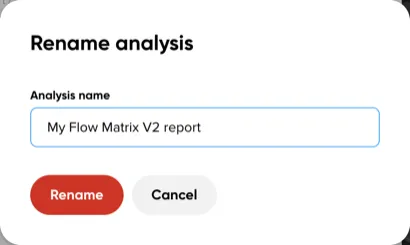
Opens the Rename analysis dialog, where you can give the report a new name.
Clone
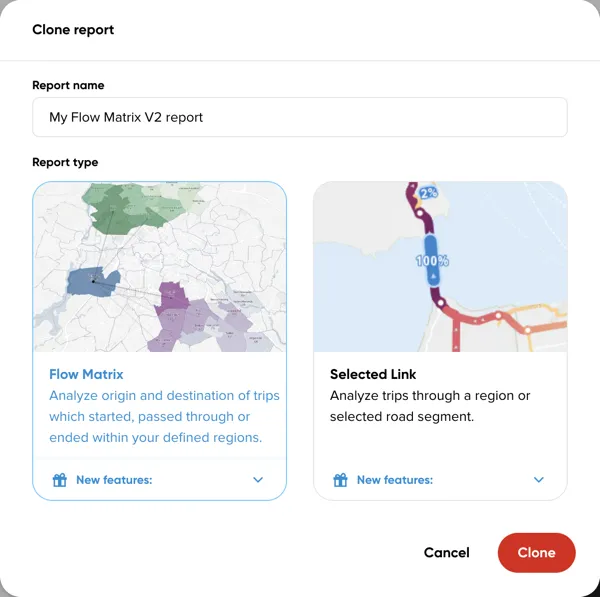
Opens the Clone report dialog, pre-filled with the report’s name. You can also select a different report type before submitting.
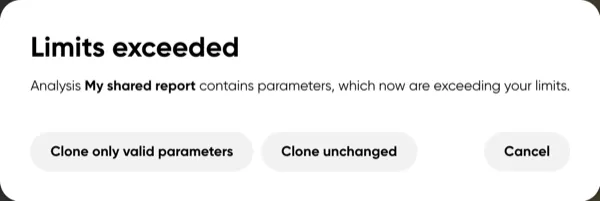
If the report contains dates or geometries outside your current limits, a Limits exceeded dialog lets you clone only the valid parameters or clone the report unchanged.
Share
Opens the Share with others dialog to generate a link to the report. Anyone with the link can view the analysis. Sharing is disabled until the report is accepted.
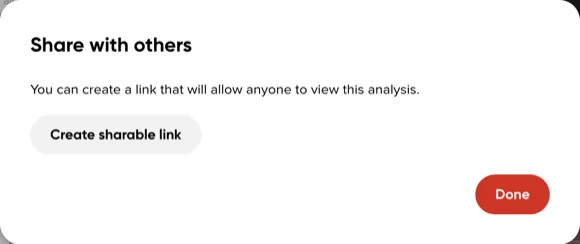
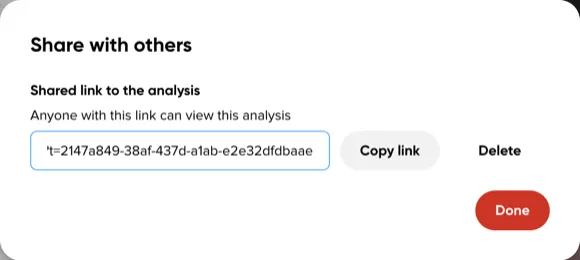
Select Create sharable link and wait for the link to be generated. You can then copy the link or delete it to revoke access.
Report configuration
Opens the report configuration panel. Its sections are described on the Analysis Info & Status page.
Left panel
Date and Time
The Date and Time selectors display one configured date-and-time combination at a time. Use their arrows to move to the previous or next range where available. Each combination has its own results.
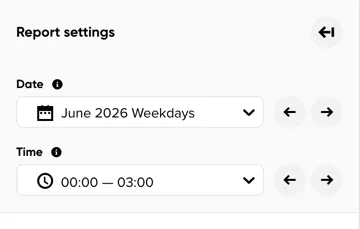
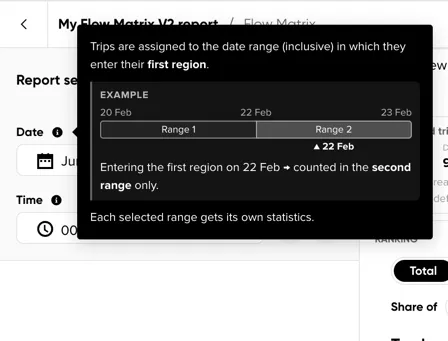
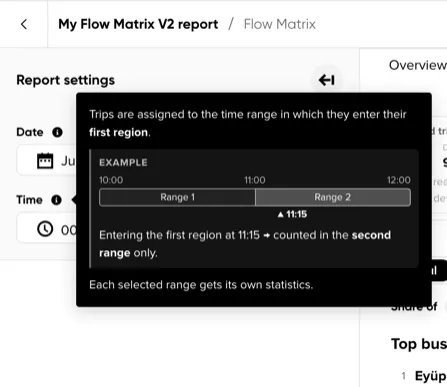
The information icon next to each selector explains how trips are assigned to that range:
- Date — Trips are assigned to the date range (inclusive) in which they enter their first region. A trip entering just before a range boundary is counted in the following range instead. Each selected range gets its own statistics.
- Time — Trips are assigned to the time range in which they enter their first region, with the same boundary rule as dates. Each selected range gets its own statistics.
Filters and other controls below the period selectors are specific to the current visualization and are documented on its results page.
Results panel
The results panel contains the tables, charts, and details for the current visualization. Its menu lets you dock it to the bottom, left, or right of the workspace. Select Set current layout as default to reuse that placement when opening other reports of the same analysis type.
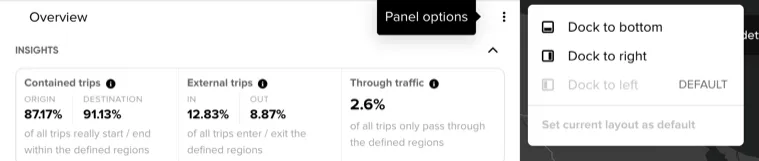
The panel’s tabs and interactions depend on the visualization.
Map area
Helper Text
The message in the top-left corner of the map explains how to interact with the current visualization. In Overview, it prompts you to select a region for traffic details. In Matrix, it describes the table selection represented on the map and warns when regions are hidden. In Flows Explorer, it explains how to select regions before a flow is defined.

Map interactions and result layers are documented on the corresponding visualization page.
Map Controls
Use the controls in the top-right corner of the map to:
- Search for a coordinate or address.
- Read and change the current map zoom.
- Select the base map style.
- Center the map on the current analysis geometry or results.
- Take a screenshot of the current map canvas.
Legend
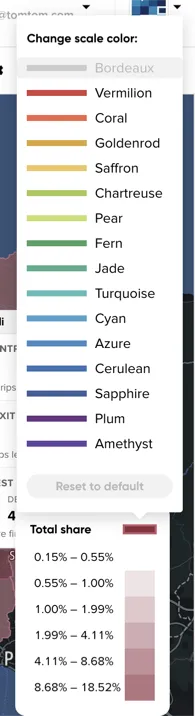
In Overview, the legend shows the color scale for the selected metric and the share range covered by each of its six steps. Select the scale swatch to change the colors or restore the default.
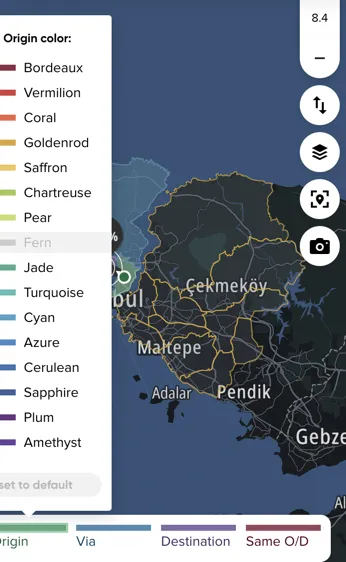
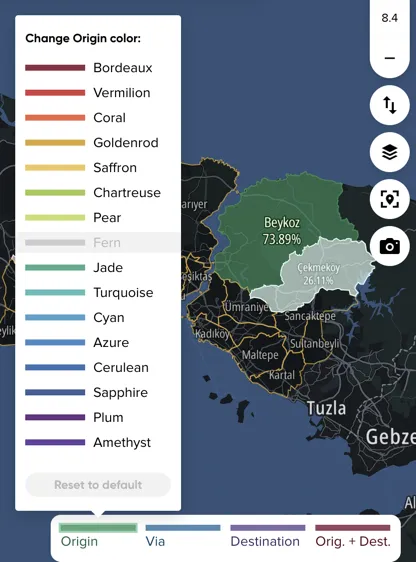
In Matrix and Flows Explorer, the legend assigns colors to region roles such as Origin, Via, Destination, and Same O/D. Select a role’s swatch to change its color, or use the reset action to restore all role colors.