
Create your first analysis
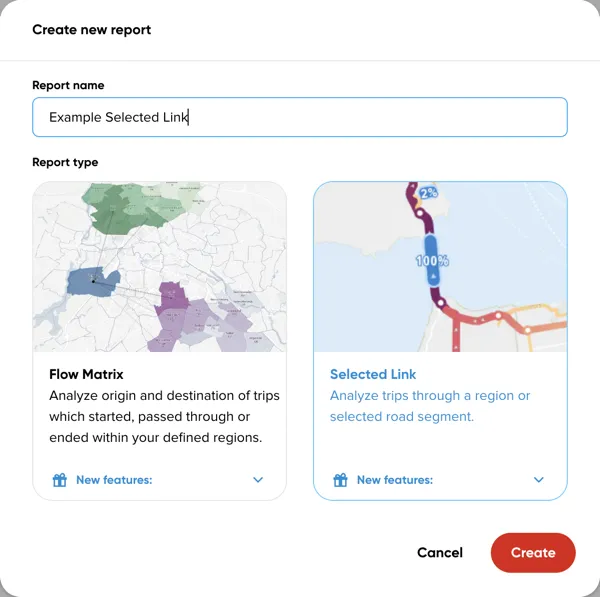
The process begins with selections on the New report dialog, then everything is configured on a single page.
New report dialog
Select Selected Link as Report type, then fill in the Report name field.
Left panel - report configuration
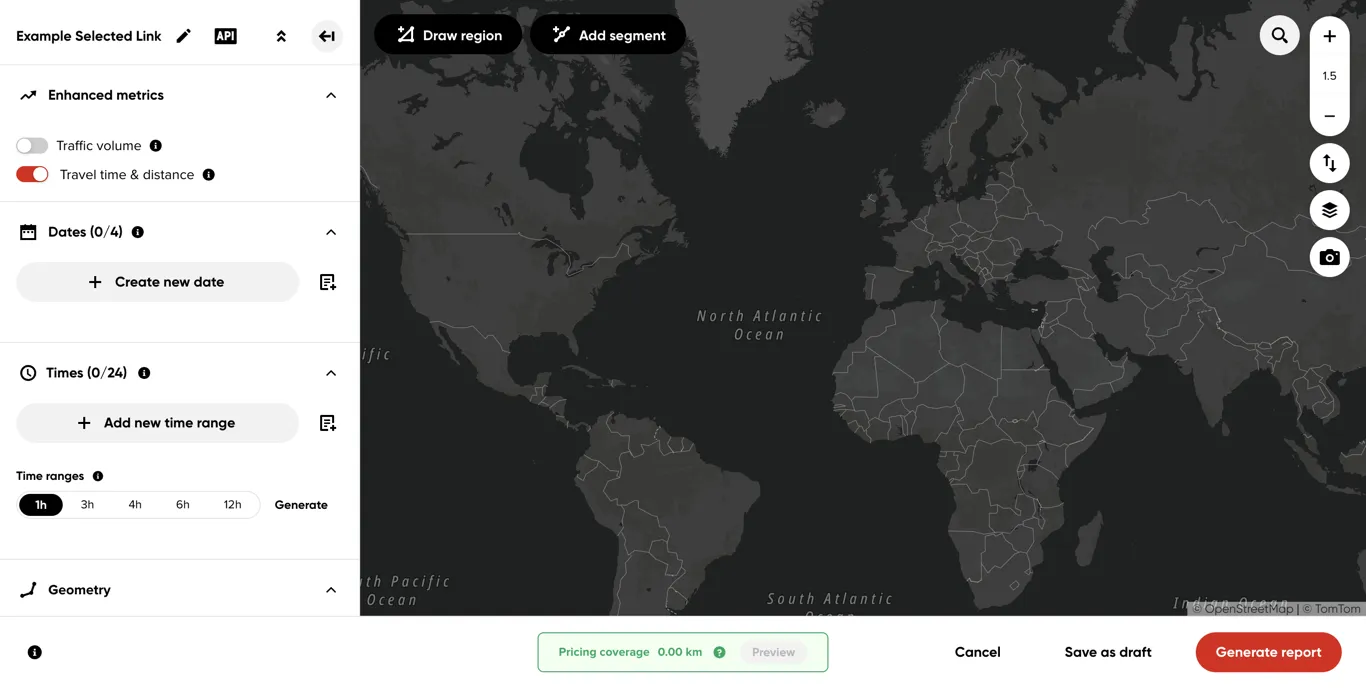
The left panel is where you configure every part of the report — dates, times, geometry, filters and settings.
Report name
The header of the left panel displays the report name and lets you edit it. The API button lets you get the current analysis parameters as JSON, which can be posted directly to the API. The icons on the right let you Collapse/Expand all sections and Collapse/Expand panel.

Enhanced metrics
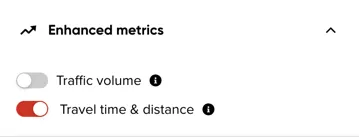
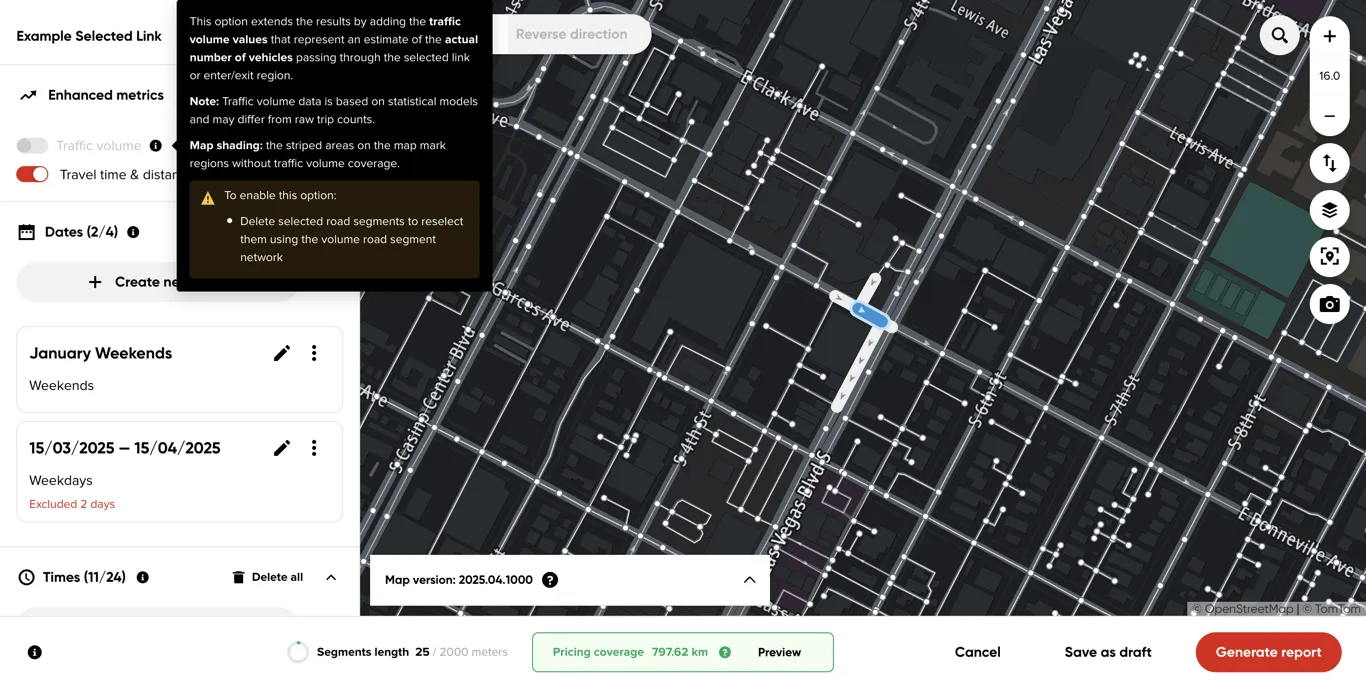
Travel time & distance is enabled by default. Traffic volume is not, and can only be turned on before you select a geometry — it’s disabled once a link or region is selected.
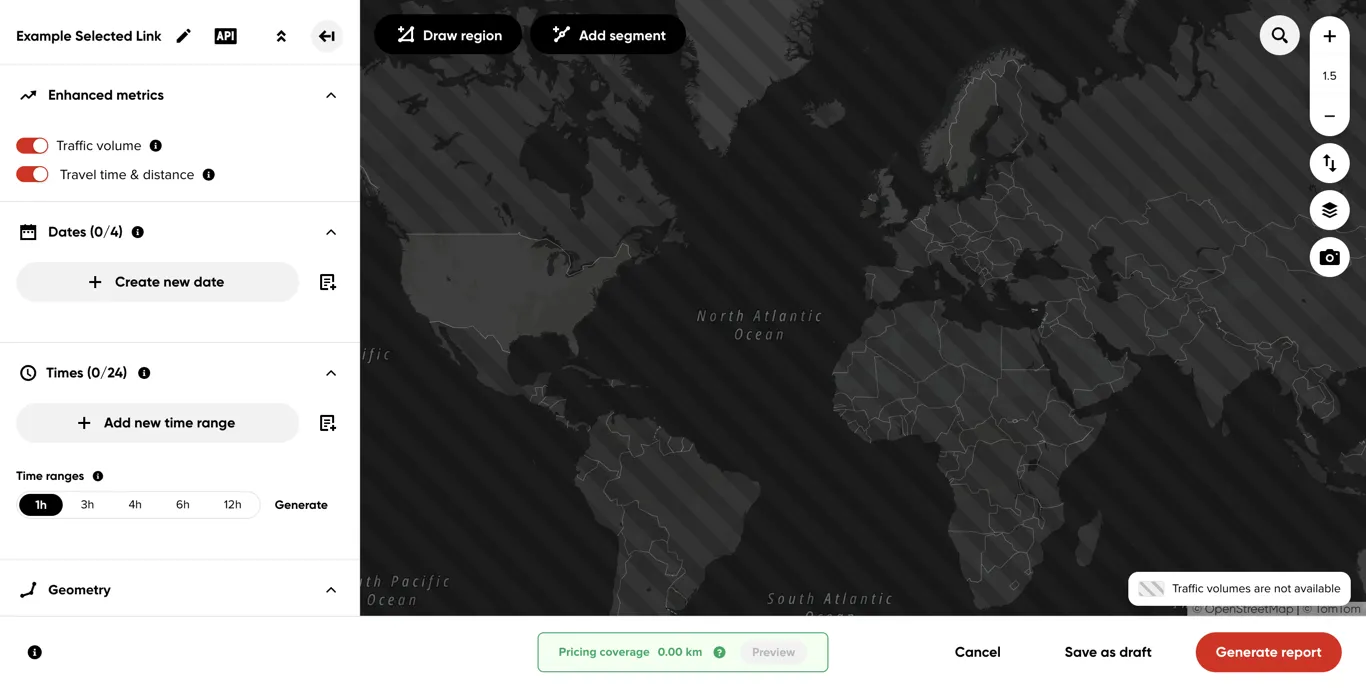
Enabling Traffic volume shows a striped overlay on the map for areas where traffic volume data isn’t available. You can then only select a link or region within an area that has traffic volume coverage.
Traffic volume data also isn’t available for the last 3 days, so your date range can only include days up to 4 days ago.
Dates section
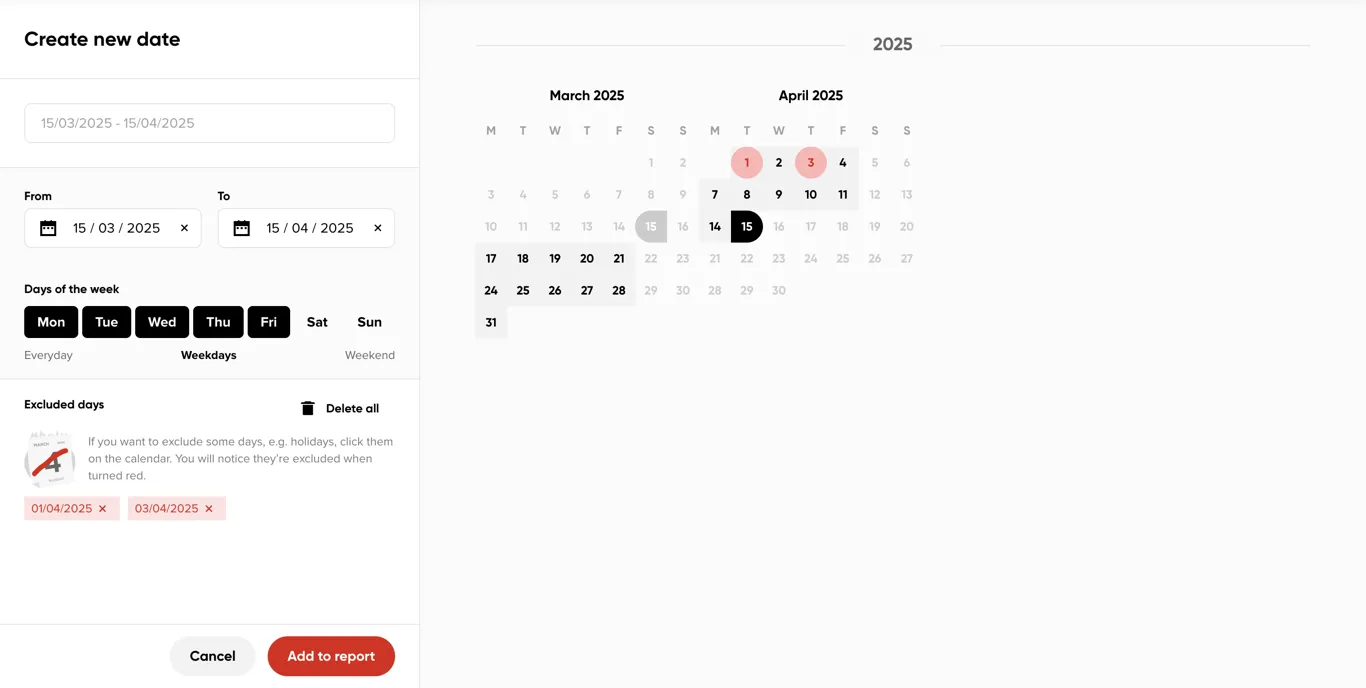
Add a date range by clicking Create new date, or reuse a saved one with Add from template. Use the weekday buttons for a quick selection of Everyday, Weekdays, or Weekend, or click individual days directly on the calendar to exclude them from the range.
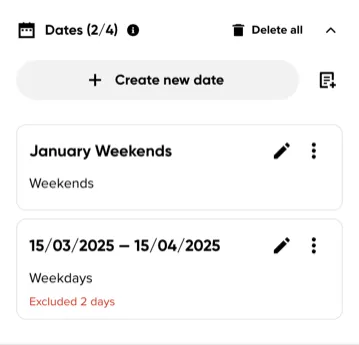
Once dates are added, the Dates section shows an overview where you can edit, delete or save date ranges as a template, or remove every range at once with Delete all in the section header.
Times section
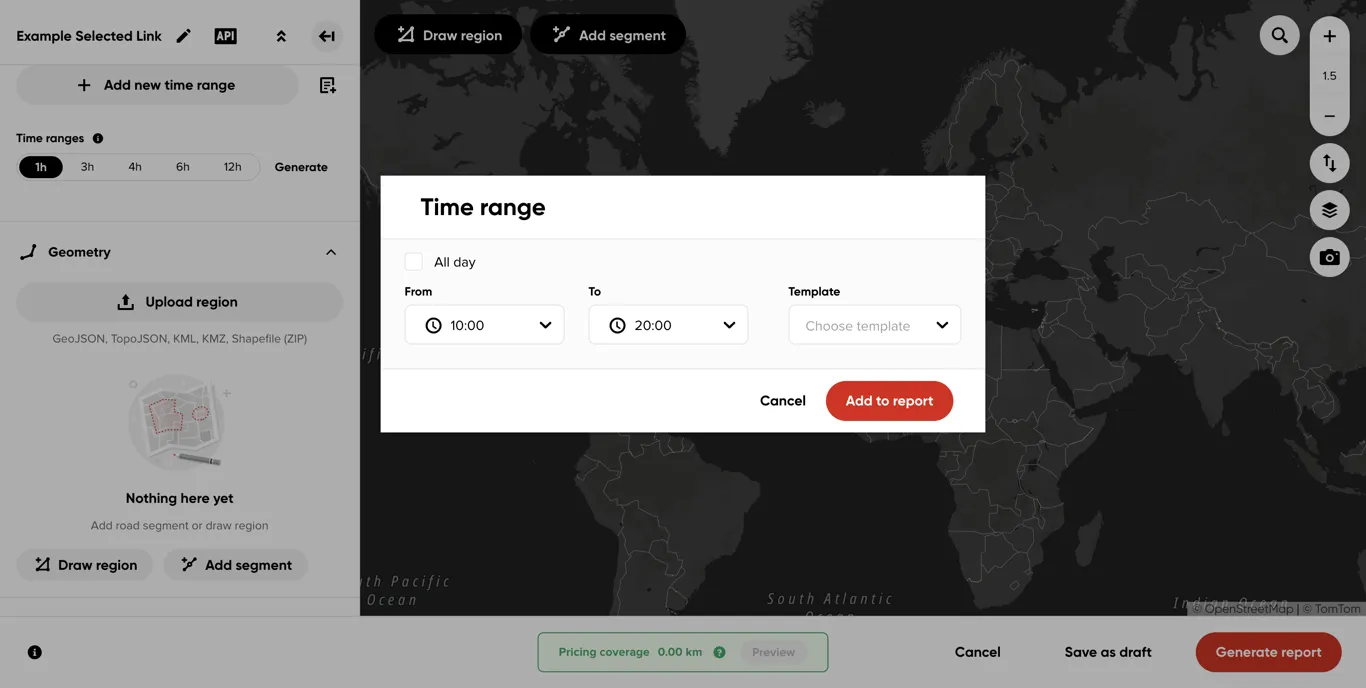
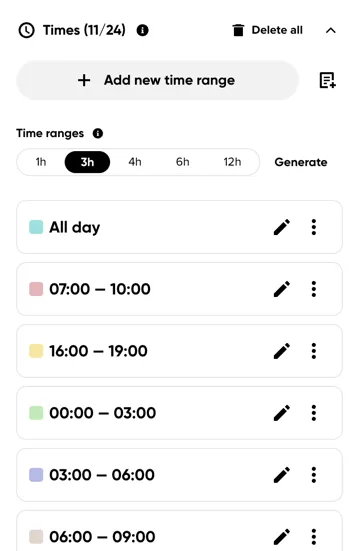
Define time ranges using Add new time range.
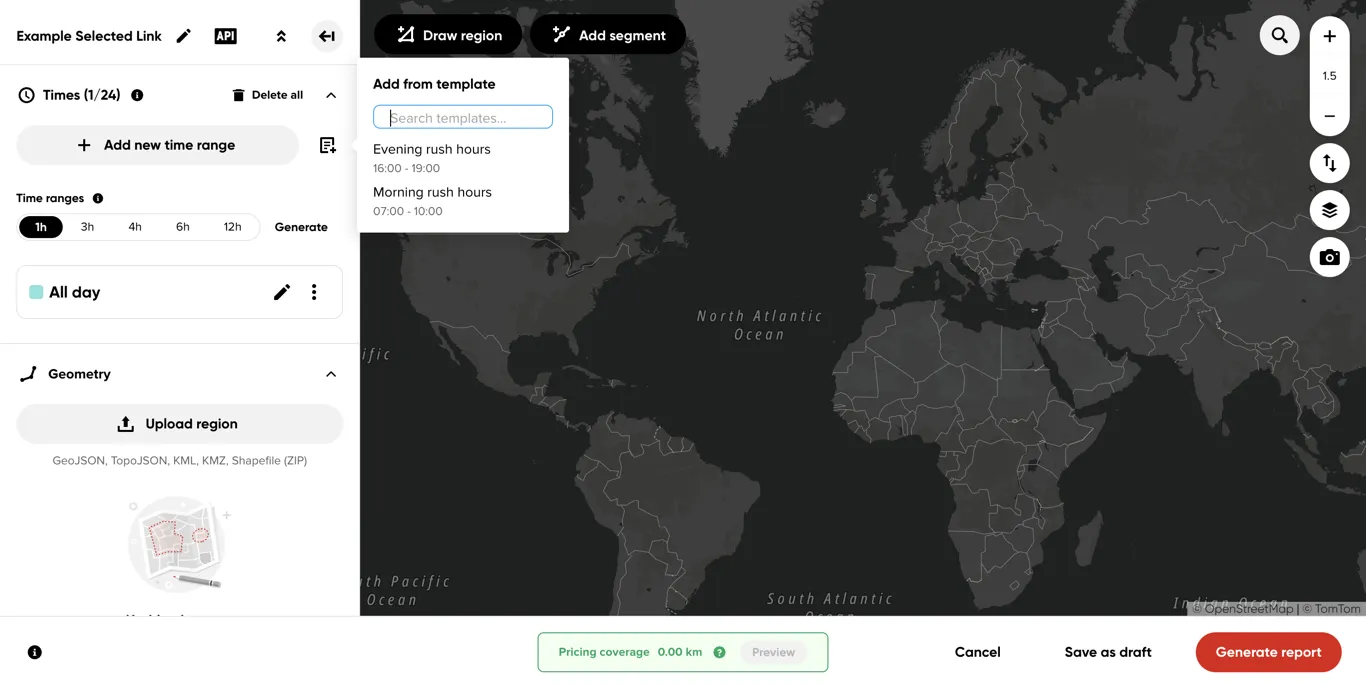
Alternatively, pick a previously saved time range from Add from template.
You can also generate a full set at once with the Time ranges component — pick a bucket size and click Generate.
Geometry
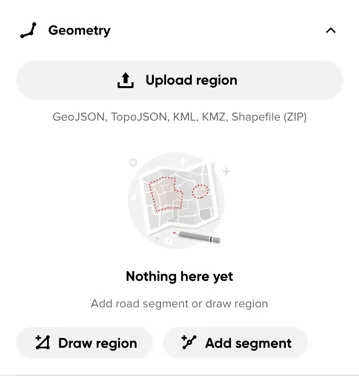
A Selected Link analysis has a single geometry — either a link (a road segment, or a chain of connected segments) or a region. Add one by clicking directly on a road segment, by drawing a region manually on the map, or by uploading a GeoJSON file.
Selecting a link
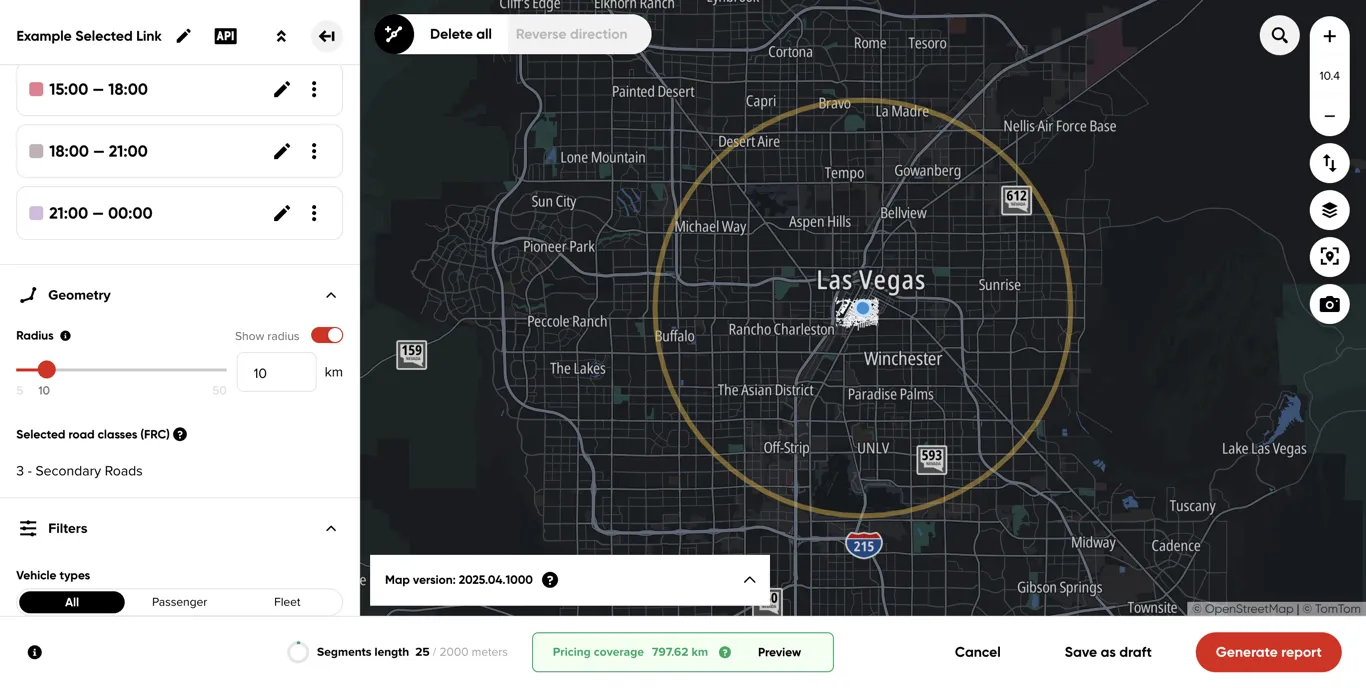
Click Add segment, then click a road segment on the map to select it as a link. The road network only renders — and can only be clicked — from zoom level 13 upward, so zoom in if you don’t see it. The left panel then shows Selected road classes (FRC) — the Functional Road Classes of the segments you selected, listed as a semicolon-separated list when you select a chain of more than one.
For the same reason, Traffic volume in the Enhanced metrics section is also disabled while a segment is selected — hover its info icon for a reminder that you’ll need to delete the segment to turn it back on.
Use Radius to set how far around the selected link paths are analyzed — any path extending beyond this radius is trimmed. For a link, the radius can be between 5 and 50 km (default: 10 km). Turn on Show radius to draw the radius as a circle on the map.
Use Delete all to remove the current link and start over.
Selecting a region
Click Draw region, then click the map to place each corner of your region and right-click to close the shape. Alternatively, click Upload region to add a region from a GeoJSON file containing a single polygon.
While drawing, keyboard shortcuts are also supported: Escape cancels the shape, Backspace removes its last point, and Enter confirms it.
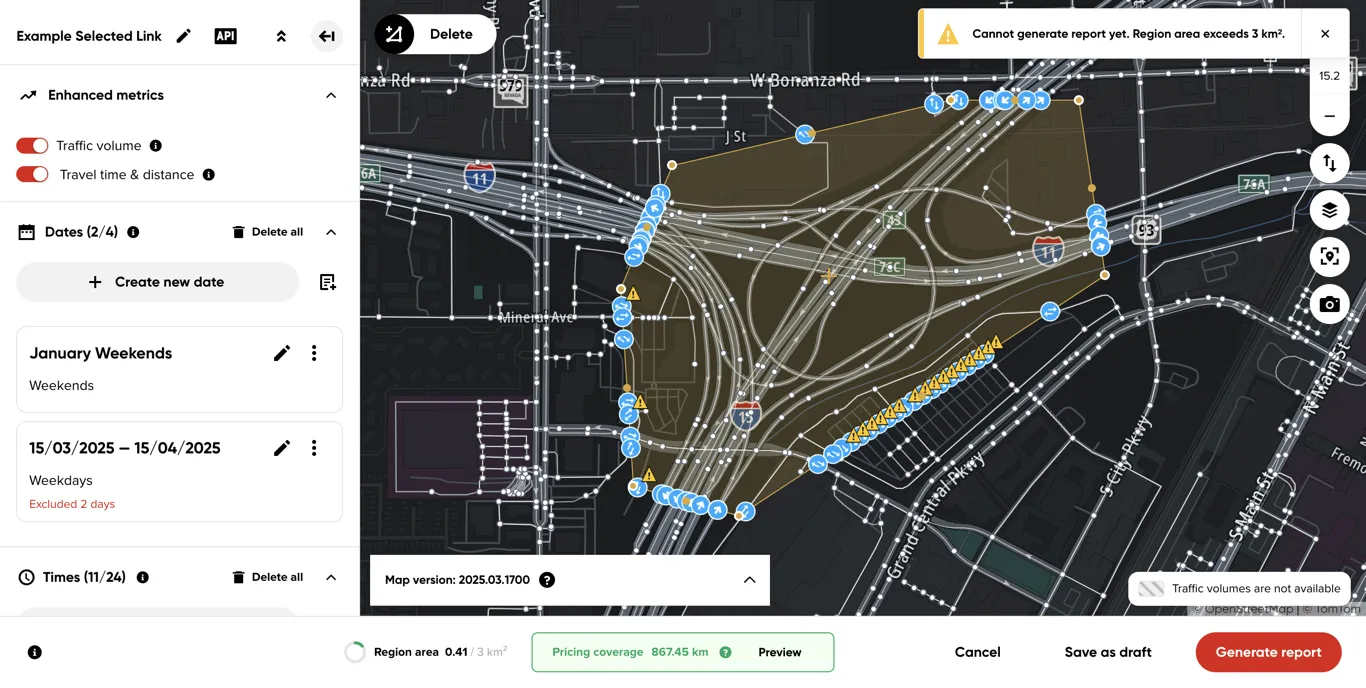
Once added, drag the region’s corner handles on the map to reshape it, drag the midpoint of an edge to insert a new corner there, or drag the region’s center to move it around the map.
Radius works the same way as for a link, but its range is narrower for a region — between 5 and 10 km (default: 10 km).
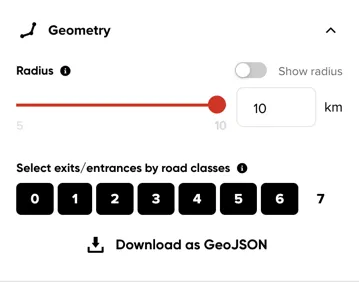
For a region, Select exits/entrances by road classes lets you choose which road classes count as entrances and exits, generating results only for the selected classes. All classes except the lowest (7) are selected by default.
If you enable Traffic volume for a region, each entrance/exit point on the map shows a warning icon when volume data isn’t available for it — hover over one to see why.
Once a region is added, use Download as GeoJSON at the bottom of the Geometry section to save it to a .json file.
Filters
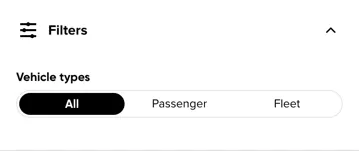
Use the Vehicle types filter to limit the analysis to specific vehicle categories.
Report validation
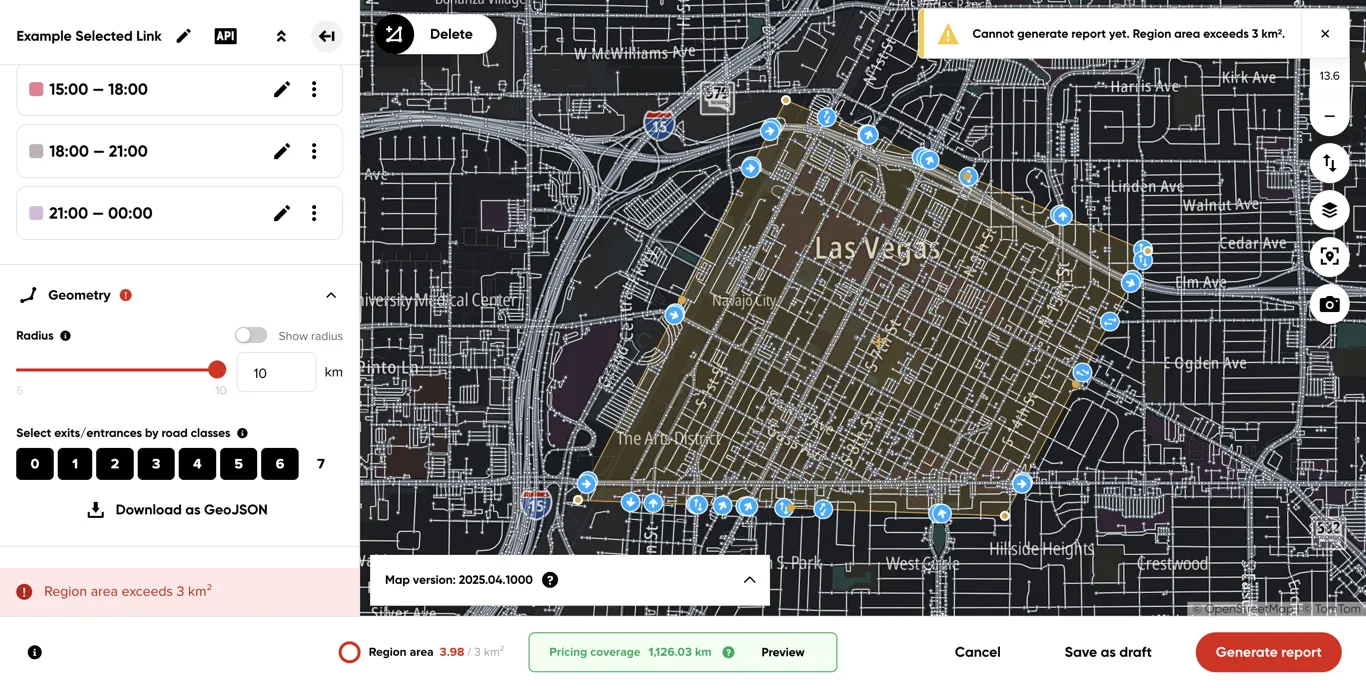
If any report parameters are invalid, you’ll see a banner at the bottom of the left panel explaining what’s wrong. When the issue comes from a specific section, that section’s header also shows an error icon with a tooltip explaining why. A link is limited by its total segment length, and a region by its area (see Report limits) — exceeding either blocks report generation until you fix it.
Map area - link and region selection
Map controls
Use the controls in the top-right corner of the map area to:
- Search for a coordinate or address
- Read and change the current map zoom
- Select the base map style
- Center the map view on the selected geometry
- Take a screenshot of the current map canvas
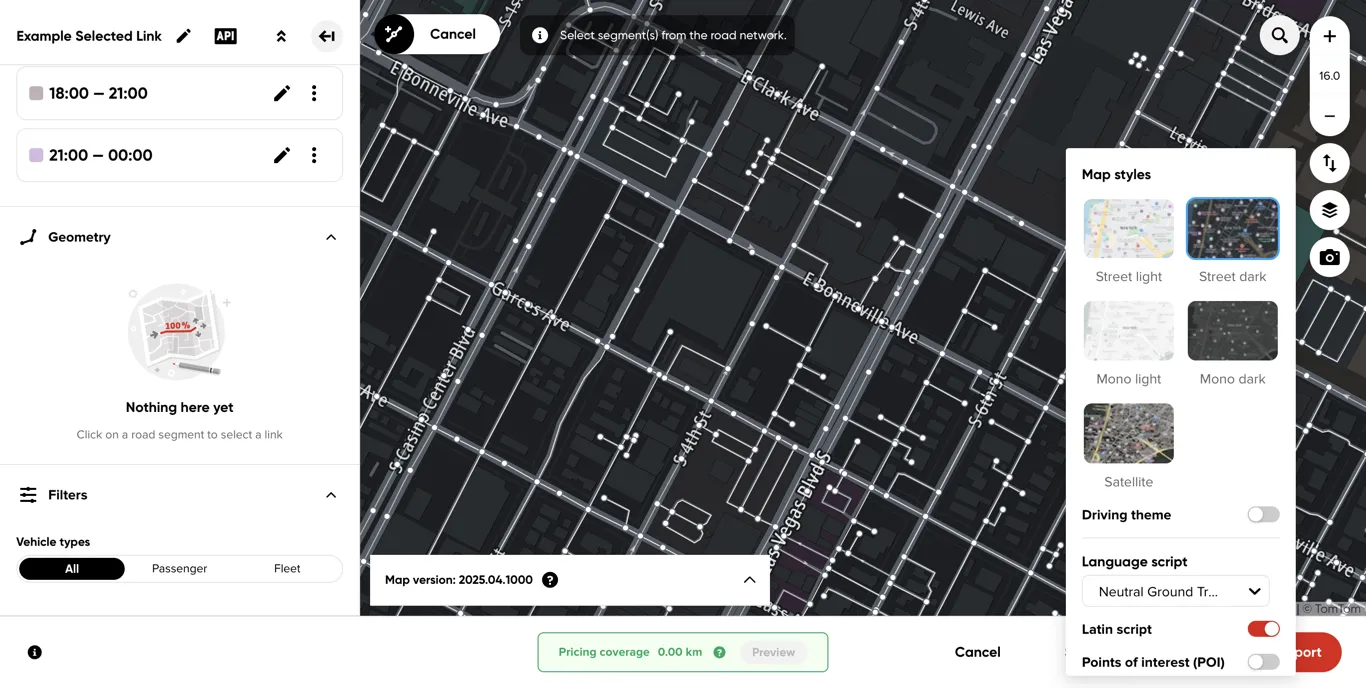
Drawing tools
Before you pick a tool, the map shows Add segment and Draw region buttons as an overlay.

Once a segment is selected, its map overlay also offers a Reverse direction button to analyze traffic in the opposite direction. It’s disabled for one-way roads, since those can’t carry traffic in reverse.
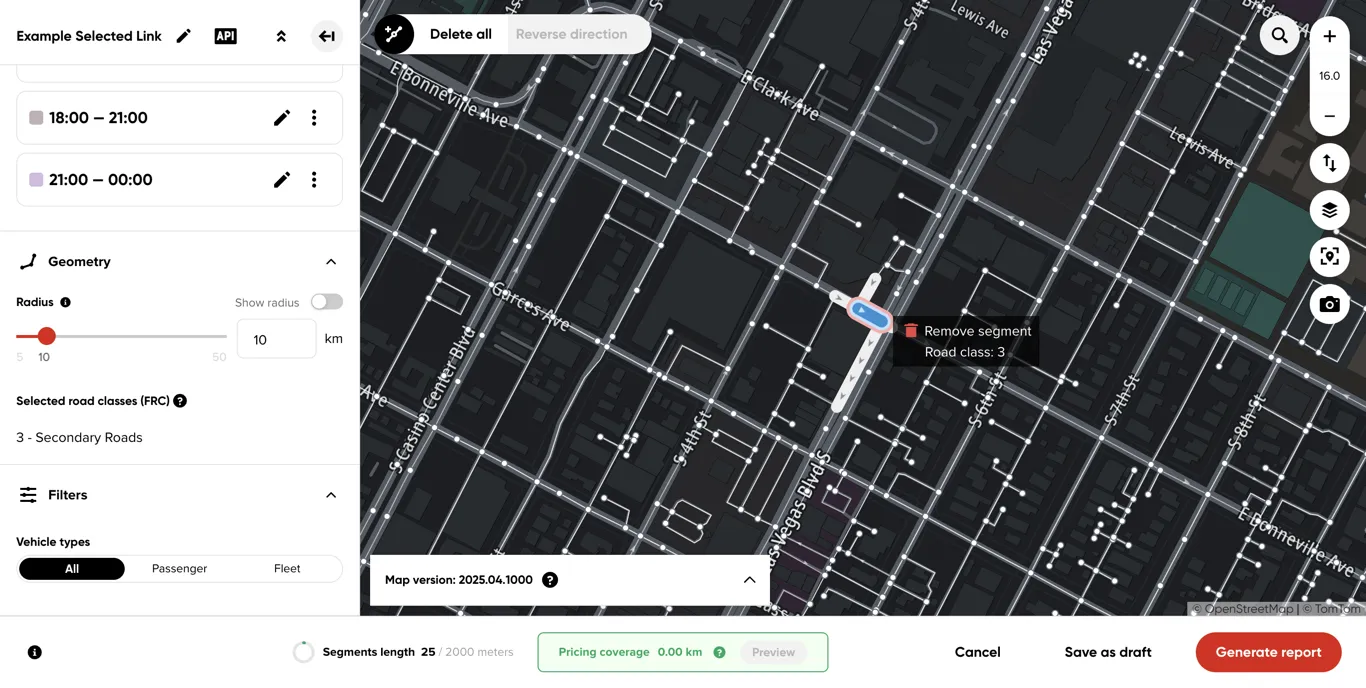
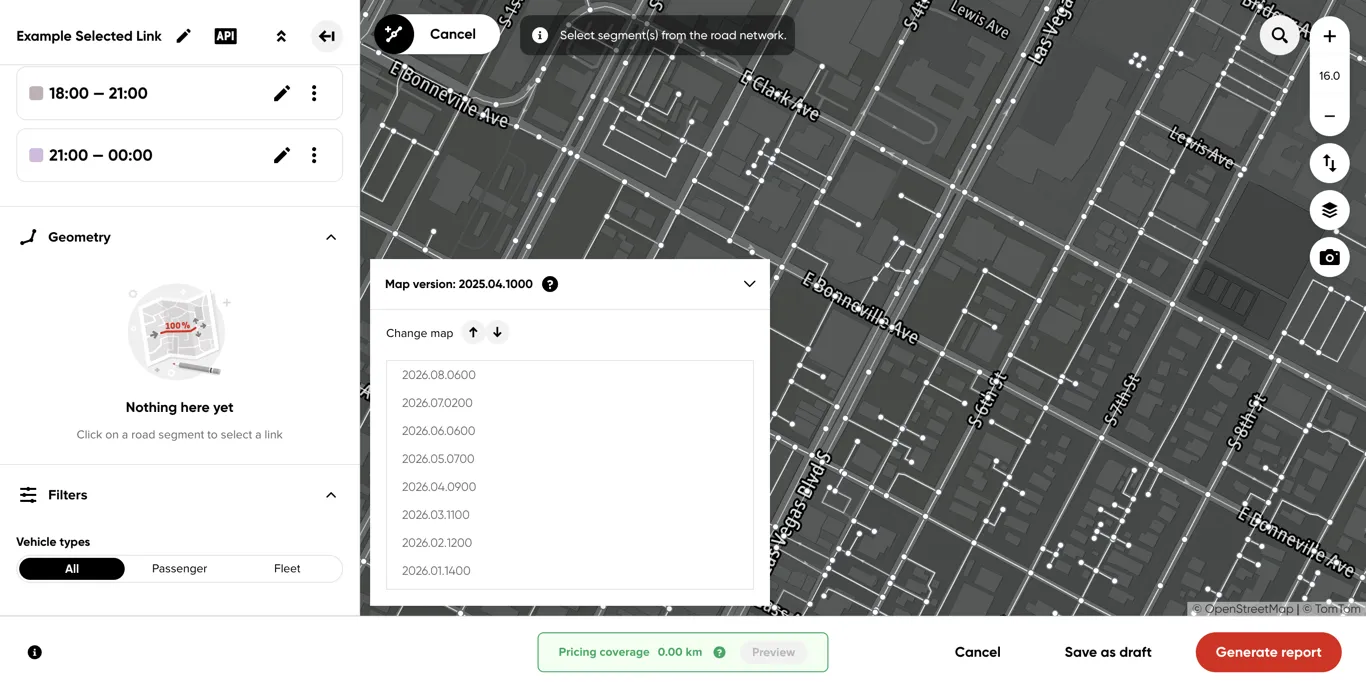
Map version selector
Until you pick a segment, the map version selector remains available as usual.
Once a segment is selected, the map version can no longer be changed — the selector shows a warning instead of the version list, and you’ll need to delete the segment first if you want to pick a different one.
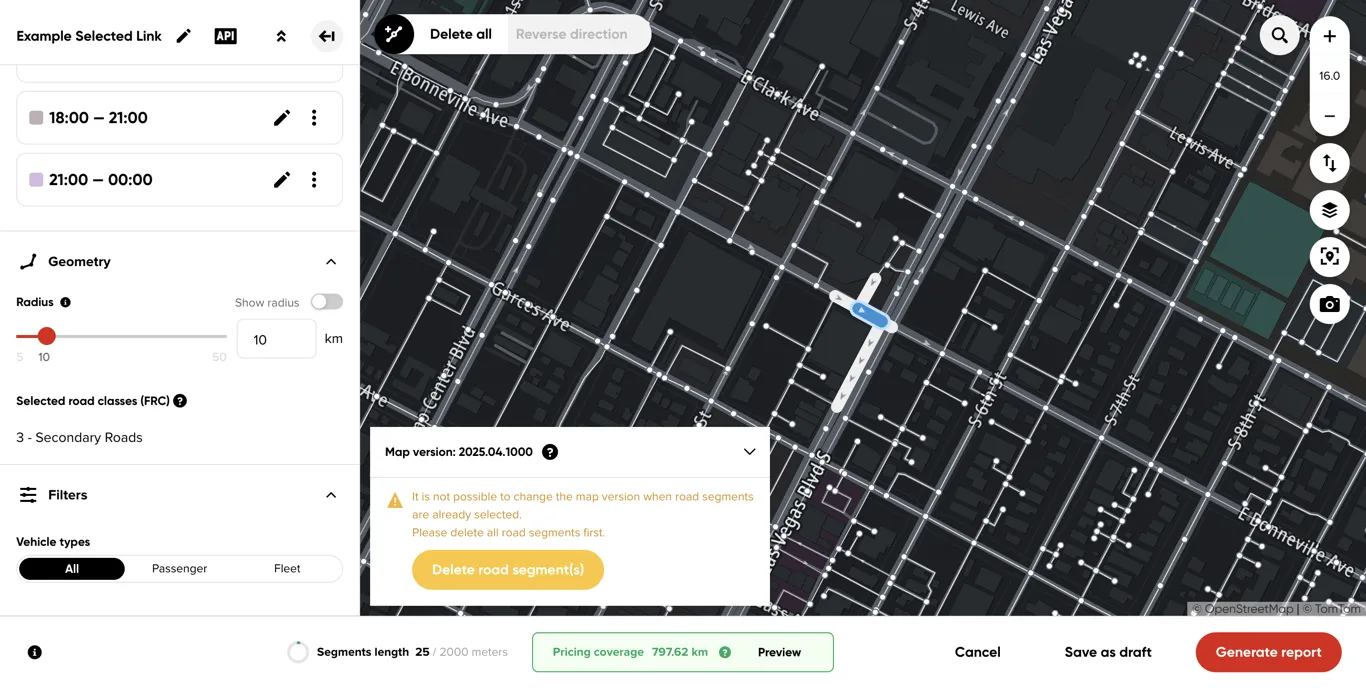
Bottom bar - status and actions
The bottom bar shows the report’s status, usage limits and creation actions throughout the configuration process.
Information icon
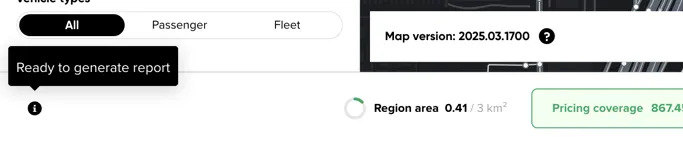
The information icon’s tooltip explains the next steps in the creation process.
Report limits
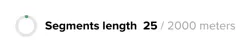
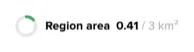
The bottom bar shows a gauge for your geometry’s usage limit, so you can see at a glance how close you are to it while configuring the report. Which limit applies depends on your geometry: a link is limited by its total segment length, a region by its area.
Pricing coverage
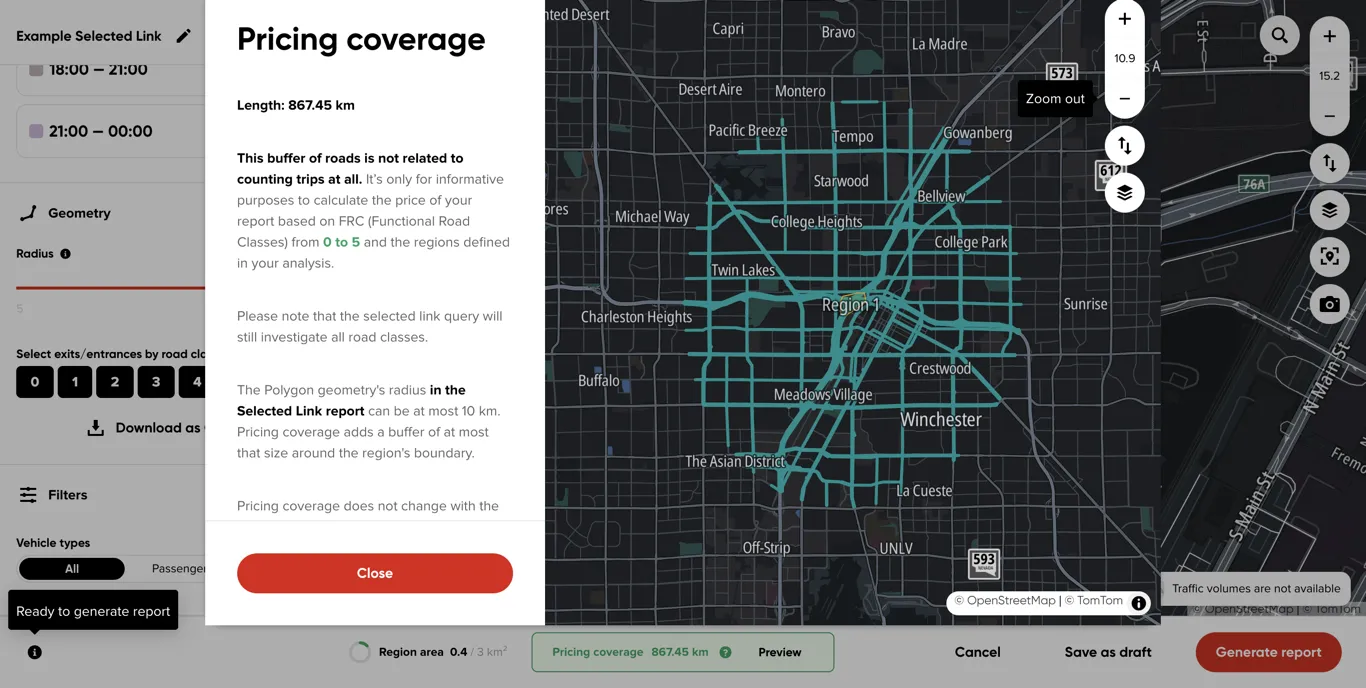
Current pricing coverage information is displayed in the middle of the bar. If it exceeds the limit, the bar turns red. Clicking Preview shows the buffer of roads used to calculate the report’s price.
This buffer of roads is not related to counting trips at all. It’s only for informative purposes, to calculate the price of your report based on Functional Road Classes (FRC) from 0 to 5 and the regions defined in your analysis.
At or below the default radius, pricing coverage is calculated on that radius using road classes 0 to 5. If you set a radius above the default, pricing coverage is split: the inner part, up to the default radius, counts road classes 0 to 5, and the part beyond it counts classes 0 to 2 only. Preview draws the exact area both parts cover.
If you select a region instead of a link, its radius can be at most 10 km, and pricing coverage adds a buffer of at most that size around the region’s boundary.
Pricing coverage does not change with the number of date ranges or time sets in your report — it depends only on the link/region and radius you select. This is the coverage for a single report — how coverage across multiple reports is billed depends on your pricing model and contract.
Actions
The right side of the bottom bar lets you Cancel the creation process, Save as draft, or Generate report.
