
Link results
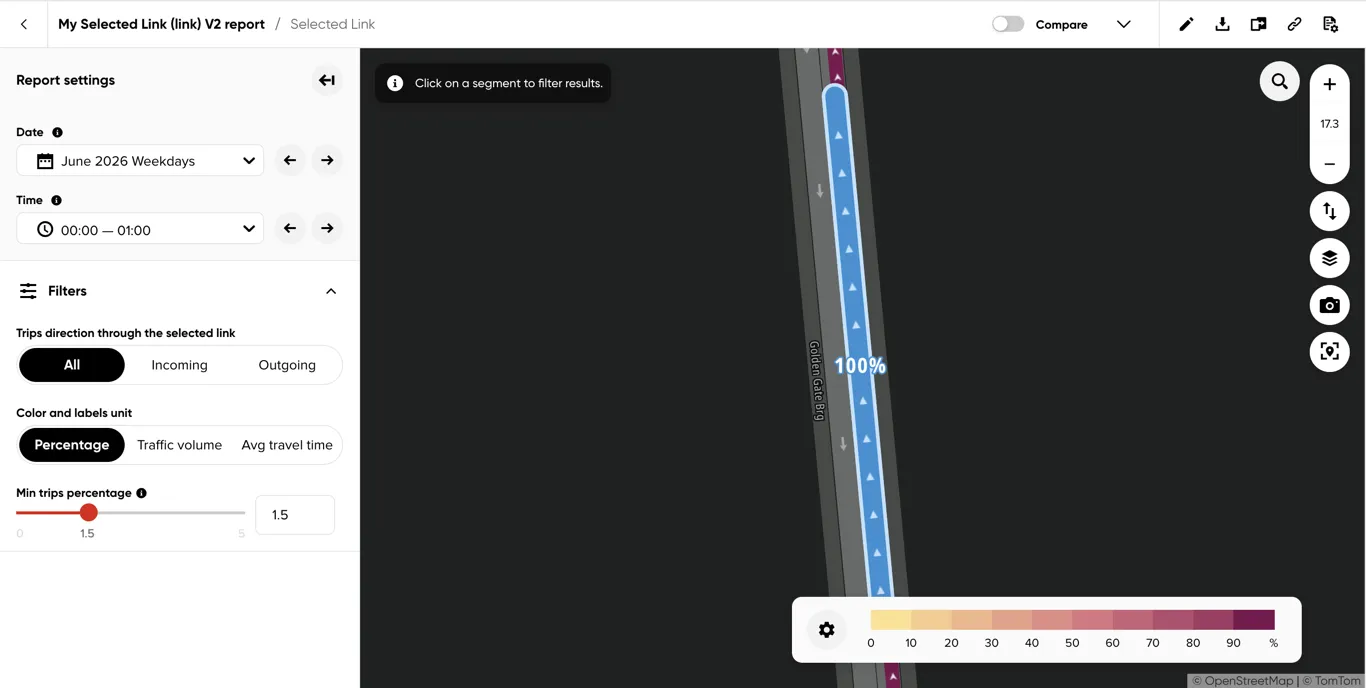
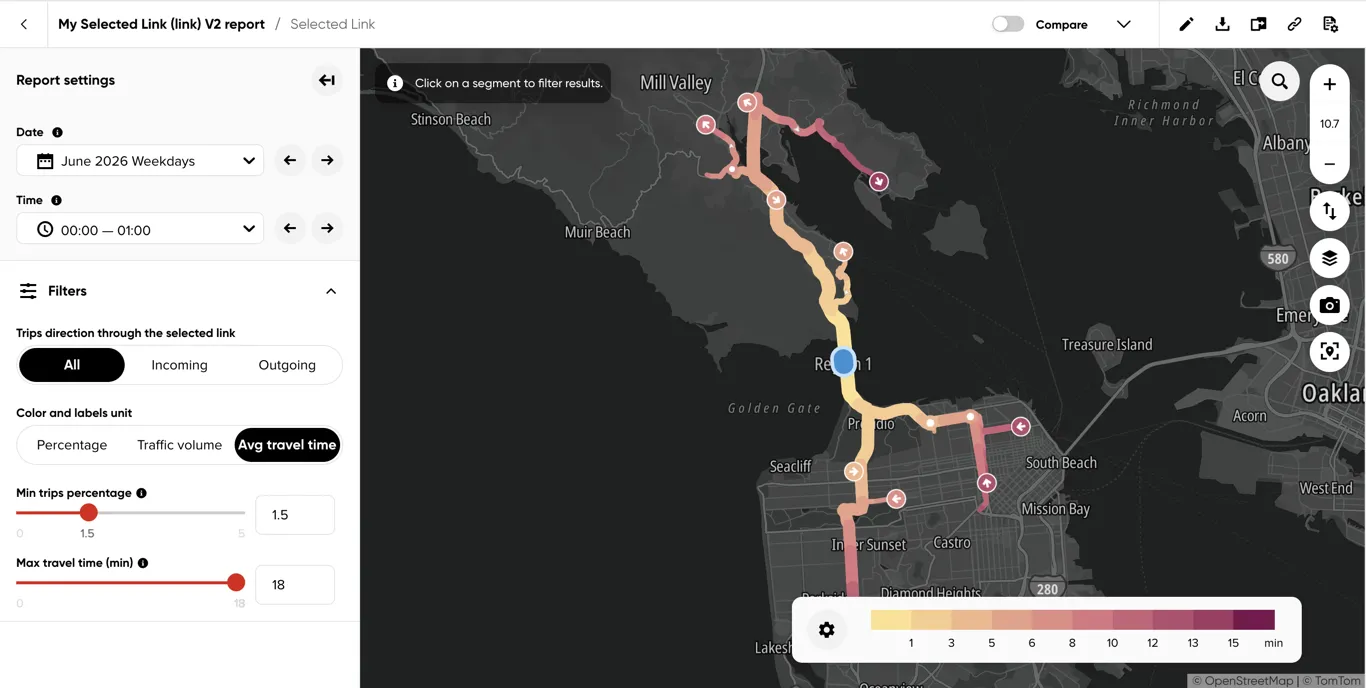
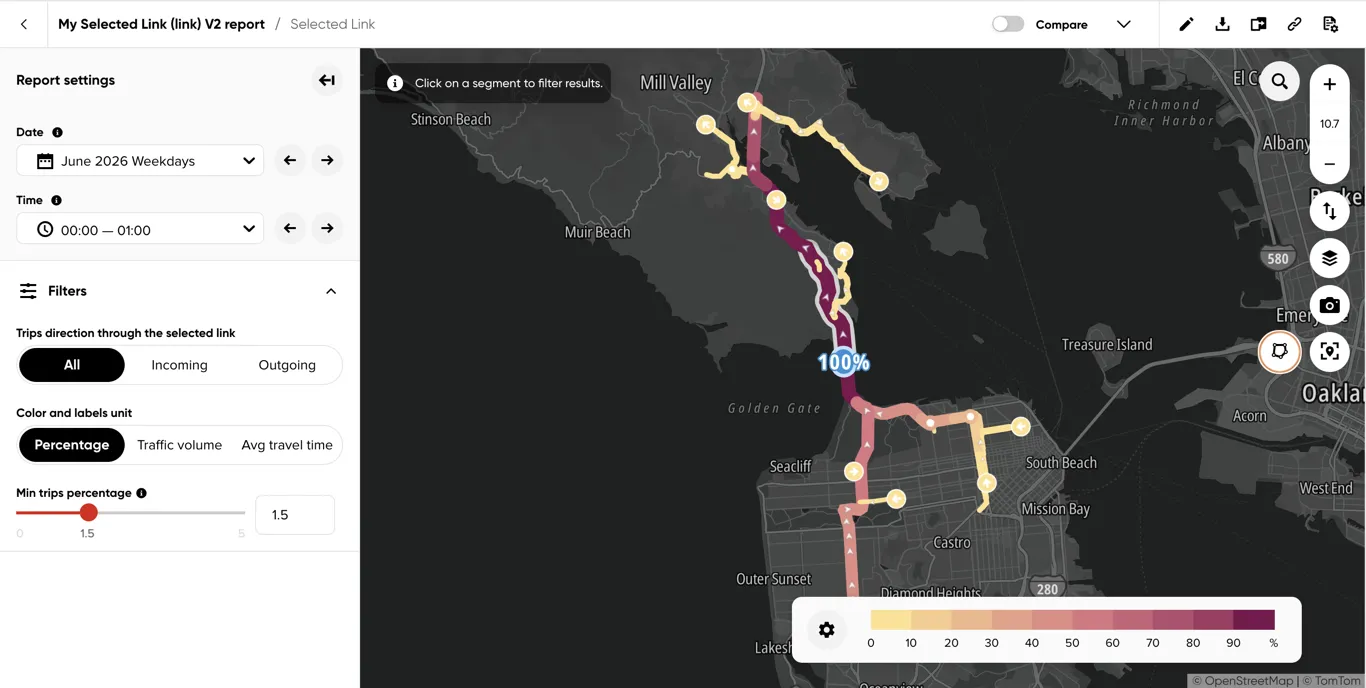
An accepted Selected Link report opens on the results page. For a link geometry, the map shows the road segments observed before or after trips pass through the selected link. Color and labels indicate the currently selected metric.
For common top-bar actions, Date and Time selector mechanics, results-panel placement, map controls, and the legend, see Viewing analysis results.
How link results are calculated
- Which trips count — a trip is counted when it passes through the selected link, and only the part of it within the report’s radius is analyzed. The link entry time determines which date range and time range it belongs to. Each trip contributes to both the Incoming result (the road it took to reach the link) and the Outgoing result (the road it took after the link). Trips that crossed the link more than once are left out.
- Segments and paths — the result is a tree of road segments growing out of the selected link. Every segment is one continuation of the path from the link, and a complete path is a chain of segments from the link to the point where trips stopped being observed: the trip ended, left the radius, its GPS trace broke off (a processing failure), or too few trips continued for the segment to be shown (a privacy trim).
- How to read the percentages — a segment’s value is the share of all trips through the selected link that reached this segment along this exact route. It is not a share of the previous segment: 5% on a segment three turns away from the link means that 5 of every 100 trips through the link drove exactly this way. The link itself reports close to 100% (slightly below, because the value is a statistical estimate), and the segments branching from any point add up to about the value of that point. The difference is the trips that ended, were trimmed or failed there. Each date range and time range is its own 100%, so compare shares between ranges as proportions rather than adding them up.
- Margin of error — the data is a sample of the traffic, so every percentage comes with a range, in percentage points, that contains the true share with 95% confidence: 5.6% ±1.1% means the true share is most likely 5.6% and almost certainly between 4.5% and 6.7%. The fewer trips observed, the wider the margin. Extending the report to more days or hours narrows it. See Confidence Intervals Methodology for how it is computed.
- Traffic volume — an estimate of the real number of vehicles, not a count of observed trips. It comes from a model trained on road traffic counters, computed for the selected link’s road segment over the analyzed days and hours, and then distributed down the tree in the same proportions as the trips. Read it as an approximate scale of the traffic: if a segment carries 5% of trips, its volume is 5% of the link’s estimated volume. It is available only for single-segment links in areas with volume coverage. See Historical Traffic Volumes for how the estimate is produced and where it is available.
- Average travel time and distance — cumulative values along the path, including the selected link itself. For Incoming they run from the start of the segment to the end of the link, for Outgoing from the start of the link to the end of the segment. The link’s own row therefore shows the time and distance of driving the link alone. Both are averaged over the trips that reached that segment. Average speed is the distance divided by the time, so it describes the whole route between the segment and the link, not the speed on that segment alone.
Top Bar - Info & Actions
Selected Link provides the following result-specific top-bar actions.
Compare
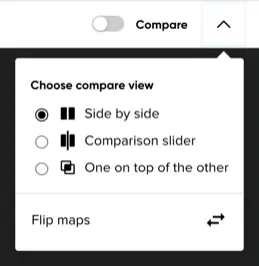
Opens a menu with Side by side, Comparison slider, One on top of the other, and Flip maps options. Compare is available when the report contains more than one date or time range — see Compare maps for the complete workflow.
Download results
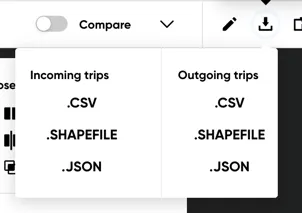
Downloads the complete Incoming trips or Outgoing trips result for the selected Date and Time range as CSV, Shapefile, or JSON. The export is independent of the active Color and labels unit and map filters.
Each row or feature represents a road segment. Its Id and Parent id define the segment tree; the remaining fields contain all available data, including percentage, margin of error, functional road class, geometry, processing failures, privacy trims, average travel time, travel distance, traffic volume, and road name. The JSON file also contains report metadata, while the Shapefile archive includes it as metadata.xml.
Left Panel - Report Settings
Date and time
See Viewing analysis results for the common selector mechanics. In Compare mode, each map has separate Date and Time selectors.
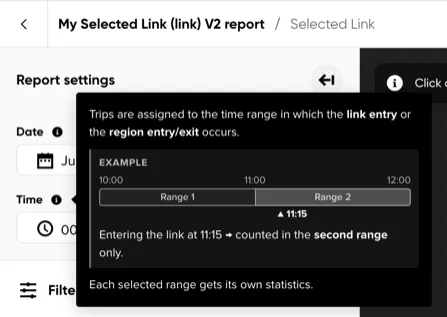
The info icon next to each label explains how trips are assigned:
- Date — trips are assigned to the inclusive date range in which they pass through the selected link. For example, a link entry on 22 February is counted only in the range containing 22 February. Each selected range gets its own statistics.
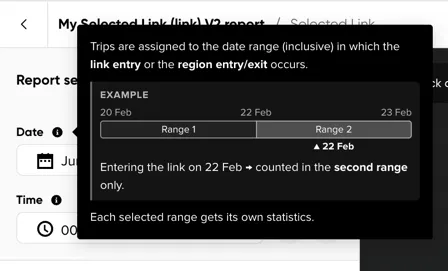
- Time — trips are assigned to the time range in which they pass through the selected link. For example, a link entry at 11:15 is counted only in the range containing 11:15. Each selected range gets its own statistics.
Filters
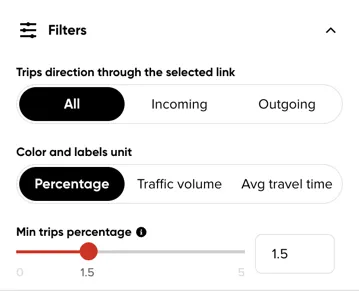
Trips direction through the selected link
- All combines Incoming and Outgoing trips traveling to and from the selected link.
- Incoming shows the road segments traveled before trips pass through the selected link.
- Outgoing shows the road segments traveled after trips pass through the selected link.
Color and labels unit
This selector determines how paths are colored and labeled. The available options depend on the Enhanced metrics enabled when the report was created:
- Percentage is always available and shows the sampled trip share and margin of error.
- Traffic volume is available only when Traffic volume was enabled and shows the estimated total vehicle volume.
- Average travel time is available only when Travel time & distance was enabled.
Thresholds
- Min trips percentage hides segments representing less than the selected percentage of trips. Because a path’s share only shrinks as it gets further from the link, raising the threshold prunes the tree from its ends and leaves the main routes.
- Min volume is shown when Traffic volume is selected and hides segments whose estimated traffic volume is below the selected value.
- Max travel time (min) is shown when Average travel time is selected. For Incoming results, each visible path extends only as far as segments from which the trip to the selected link takes no more than the selected time. For Outgoing results, it extends only as far as segments that can be reached from the selected link within that time. Segments beyond the limit are hidden.
Drag a threshold slider or enter its value in the field beside it. The map, labels, color scale and table update together. Paths hidden by any of these thresholds are greyed out in the results table.
Result metrics
Percentage shows each segment’s share of trips through the selected link, including its margin of error.
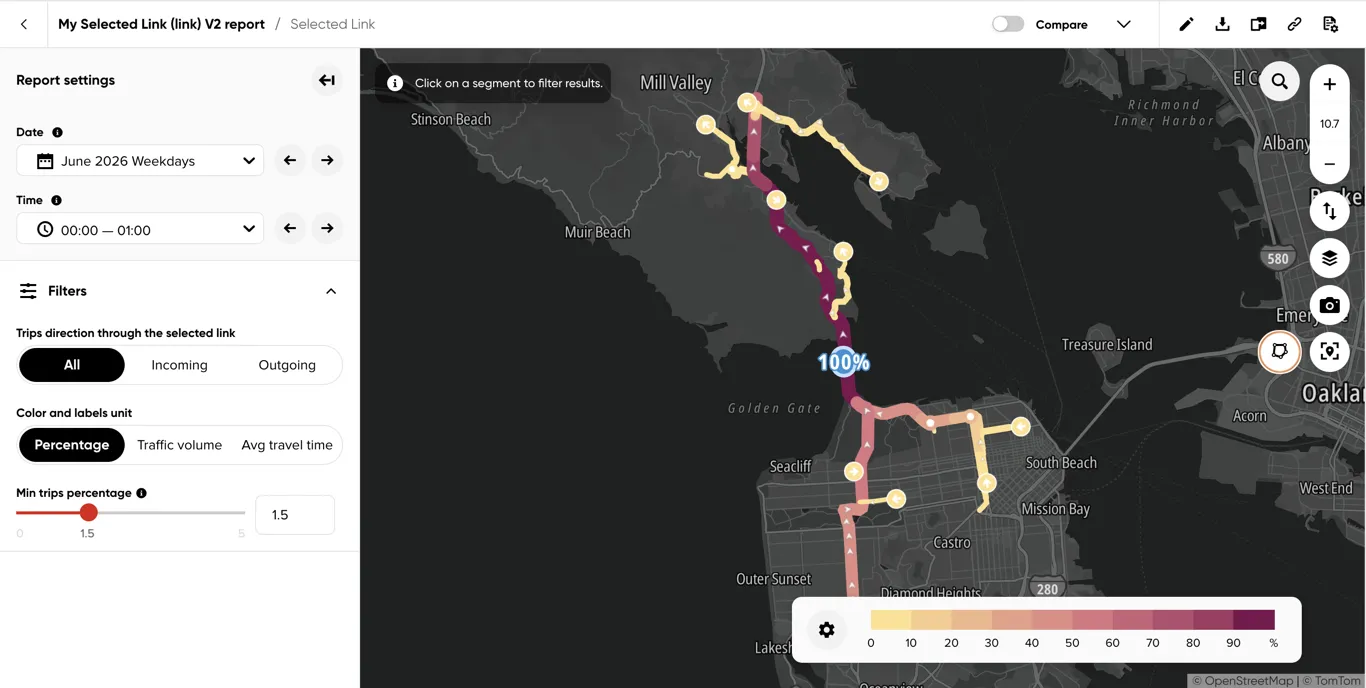
Traffic volume estimates the total number of vehicles represented by the sampled trips.
Average travel time colors each segment by the average travel time between that segment and the selected link. For Incoming results, the maximum-travel-time filter shows where vehicles were before reaching the link within the selected time. For Outgoing results, it shows how far vehicles traveled from the link within that time.
Results Panel
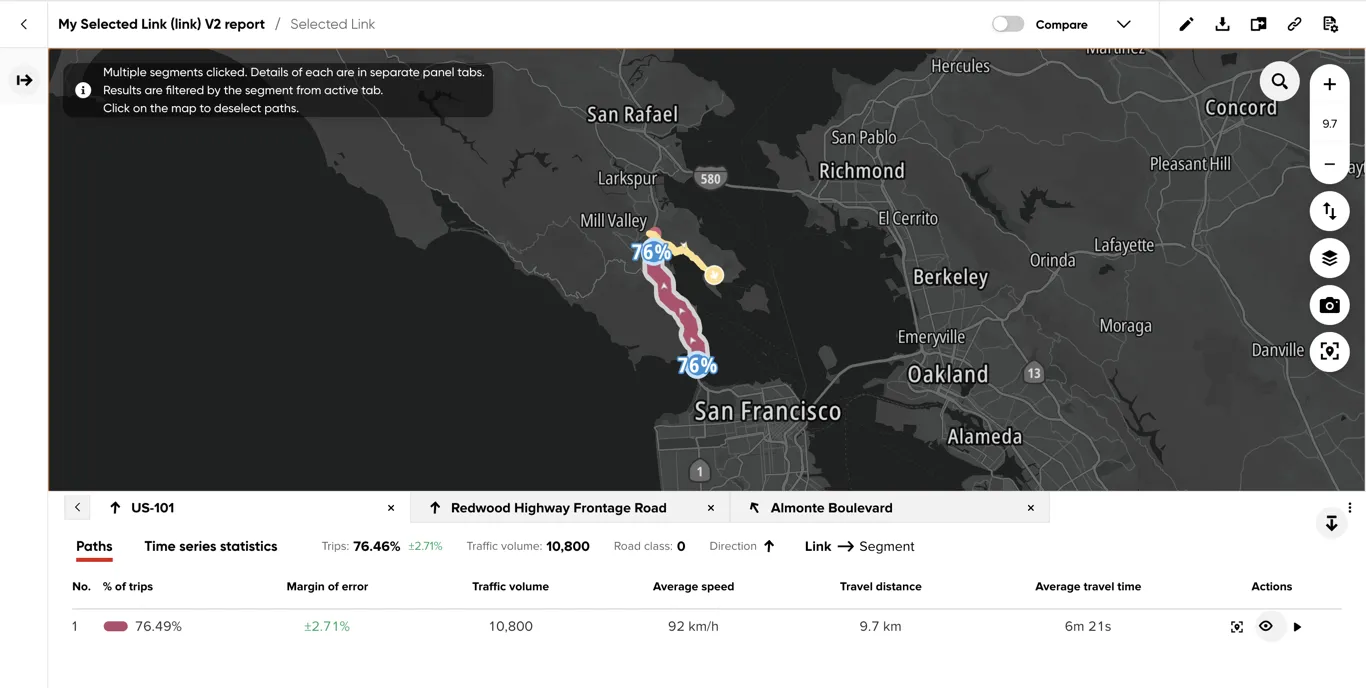
Click a result segment on the map to filter the display to paths that include it. A results panel opens with one tab per selected segment. The table lists each complete path and its values. Hovering a row highlights that path on the map.
Paths
Each row is one complete path: a route from the selected link through the clicked segment to the point where trips were last observed. Depending on the report settings, columns can include trip percentage and margin of error, traffic volume, average speed, travel time, and travel distance.
- % of trips is the share of all trips through the selected link that followed exactly this complete route. Rows through the same segment therefore add up to about that segment’s value on the map. The panel header shows the same figures for the clicked segment as a whole.
- Margin of error applies to that share, as described in How link results are calculated.
- Traffic volume, Travel distance, Average travel time and Average speed describe the whole route between the end of the path and the link, not the clicked segment alone.
- In Compare mode, each Map 1 and Map 2 row is a share of its own period’s trips, so the two rows can be compared as proportions.
The action icons on each row let you:
- Zoom the map to the complete path.
- Hide or show a path on the map when the table contains multiple paths. This action is disabled when only one path is listed.
- Play the route animation.
To view time-series statistics, select the Time series statistics tab above the table.
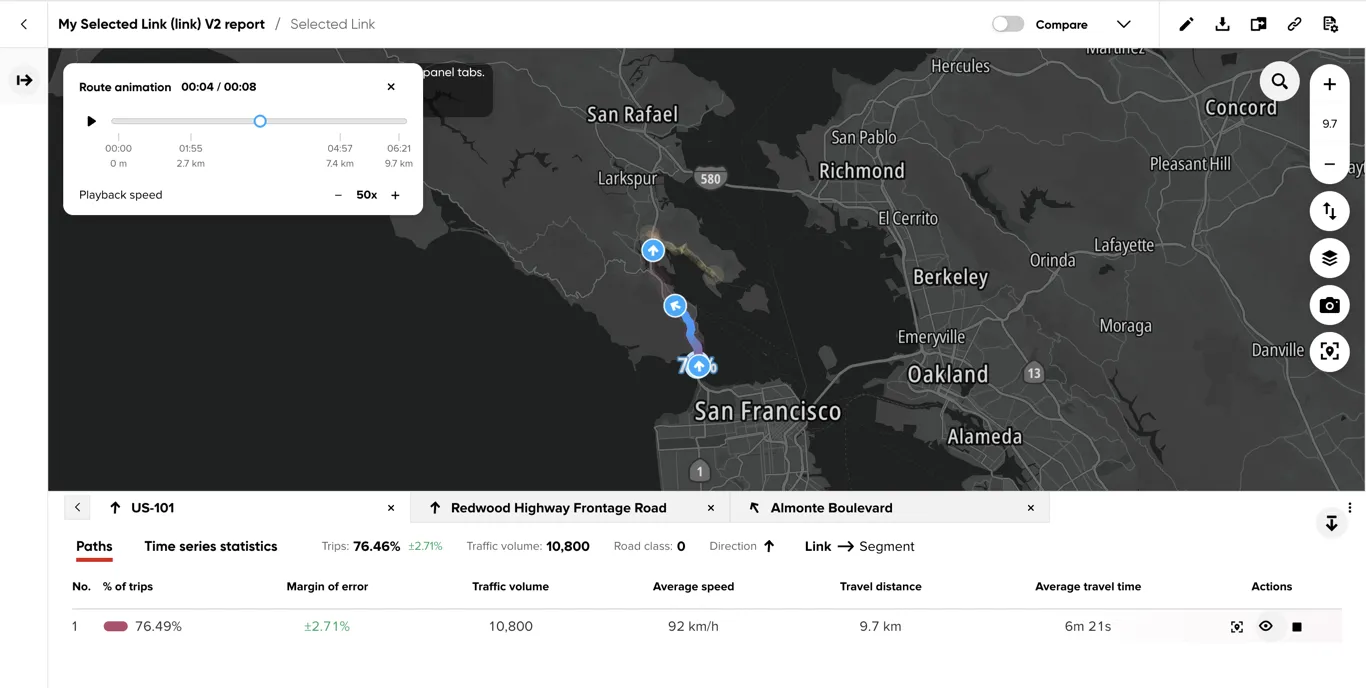
Route animation
Play a path to animate a vehicle along the complete route. The map overlay shows elapsed and total travel time, route-distance markers, a timeline scrubber, and playback-speed controls.
Time series
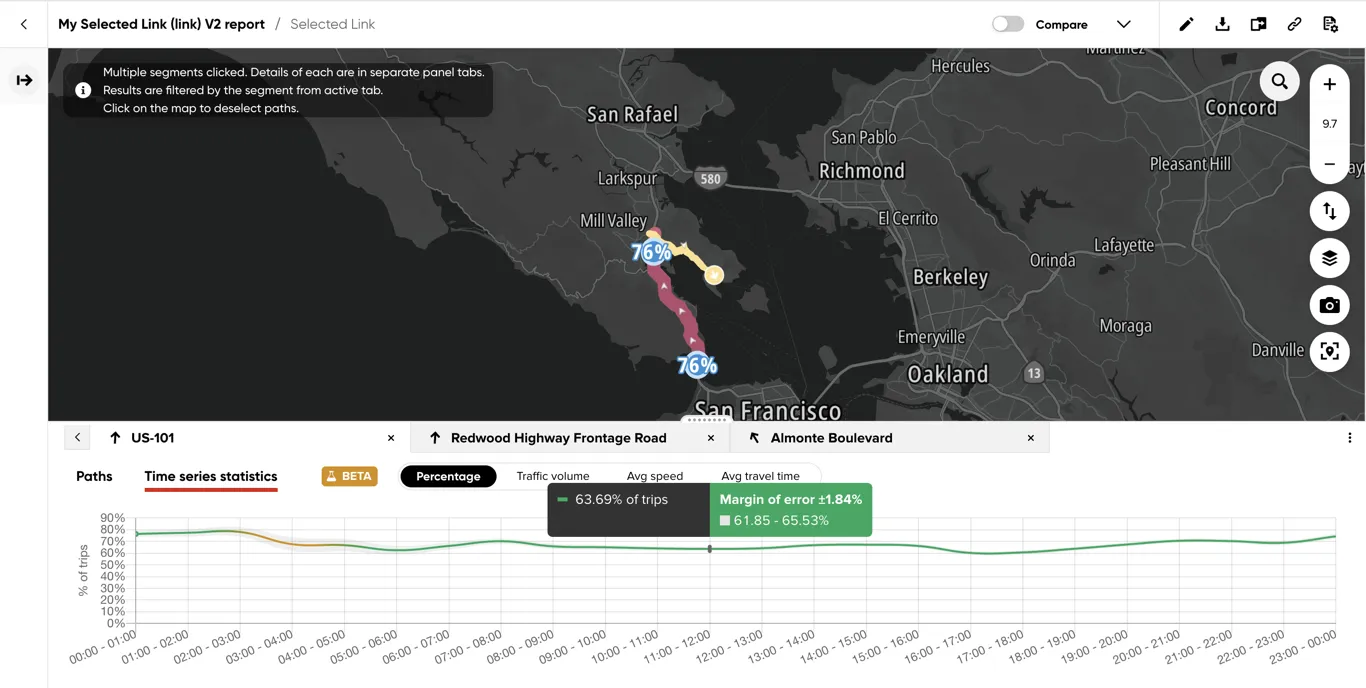
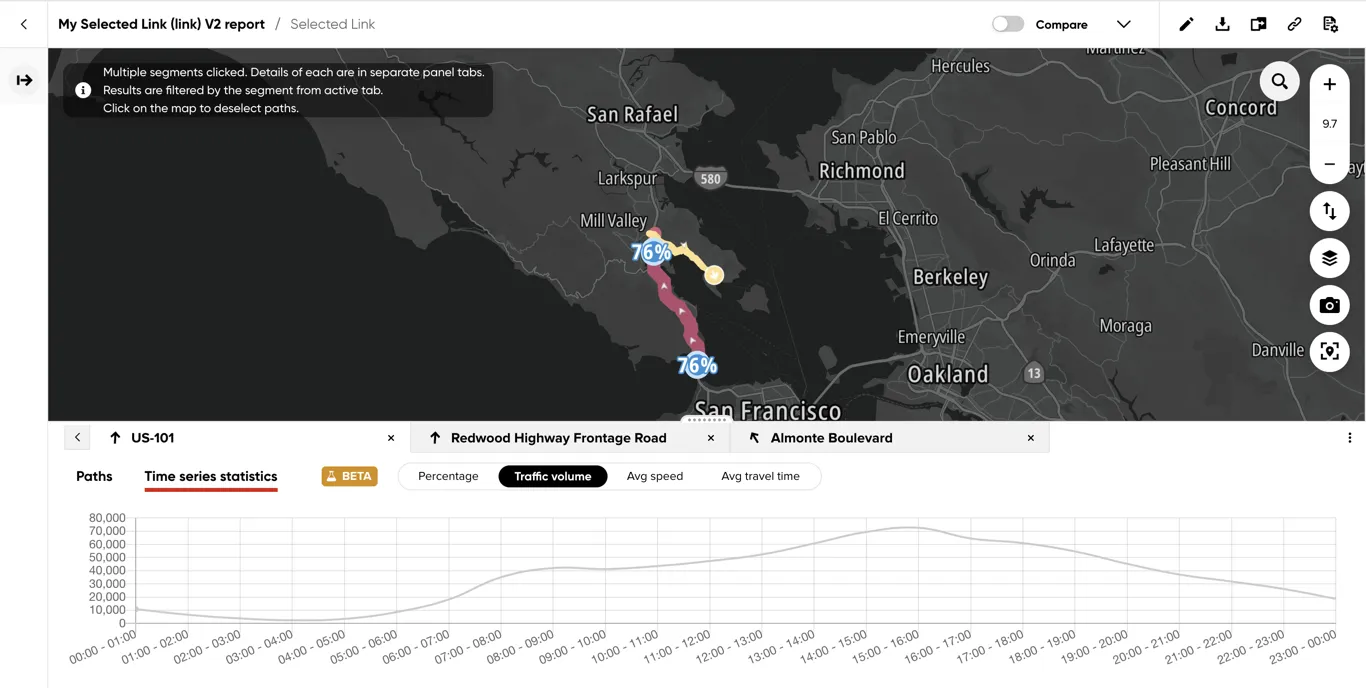
For reports with multiple time ranges, Time series statistics charts how the selected path changes across those ranges. Use the path and metric controls above the chart to choose what is displayed.
Percentage shows the path’s share of sampled trips in each time range, with the confidence interval drawn as a band around the line. Unlike the other metric tooltips, its tooltip also shows the margin of error and the interval’s lower and upper ends. Because every time range is its own 100%, the line shows how the route’s popularity changes over the day, not how the traffic volume changes. See Confidence Intervals Methodology for details.
Traffic volume shows the estimated vehicle volume for the path in each time range.
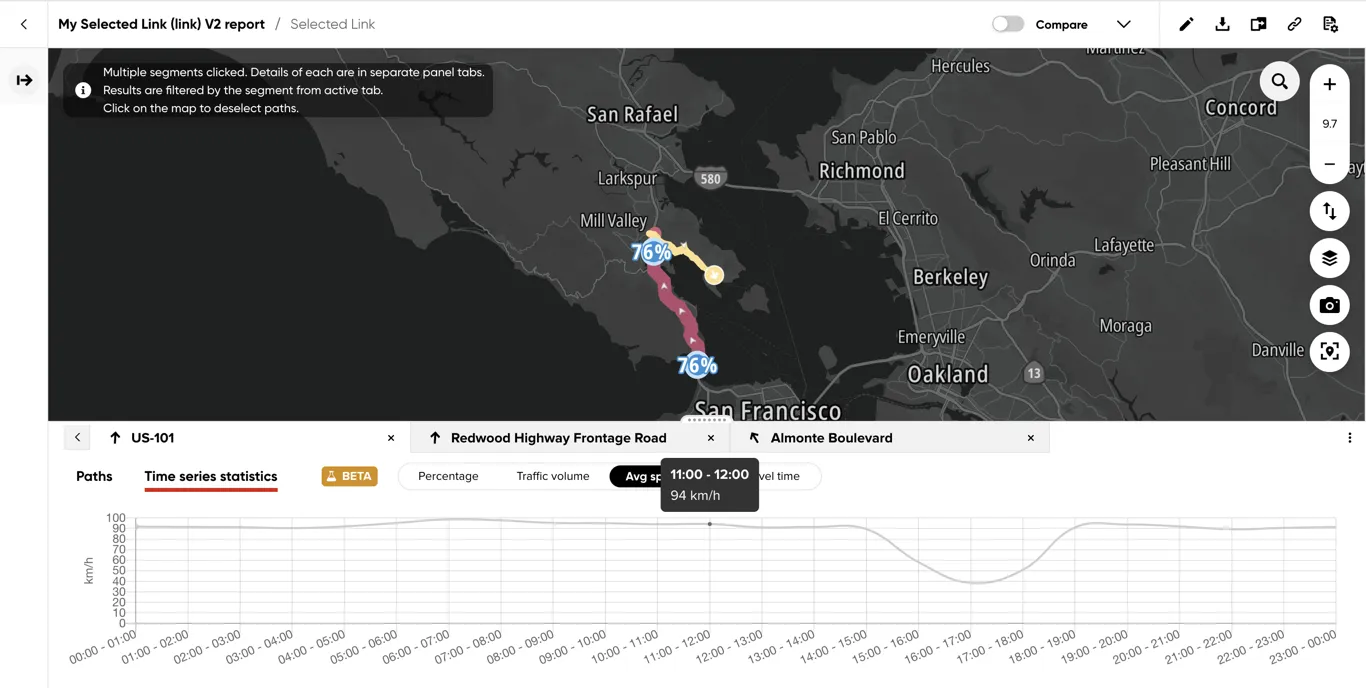
Average speed shows the path’s average vehicle speed in each time range. Hover over the line to see the value for a specific time range.
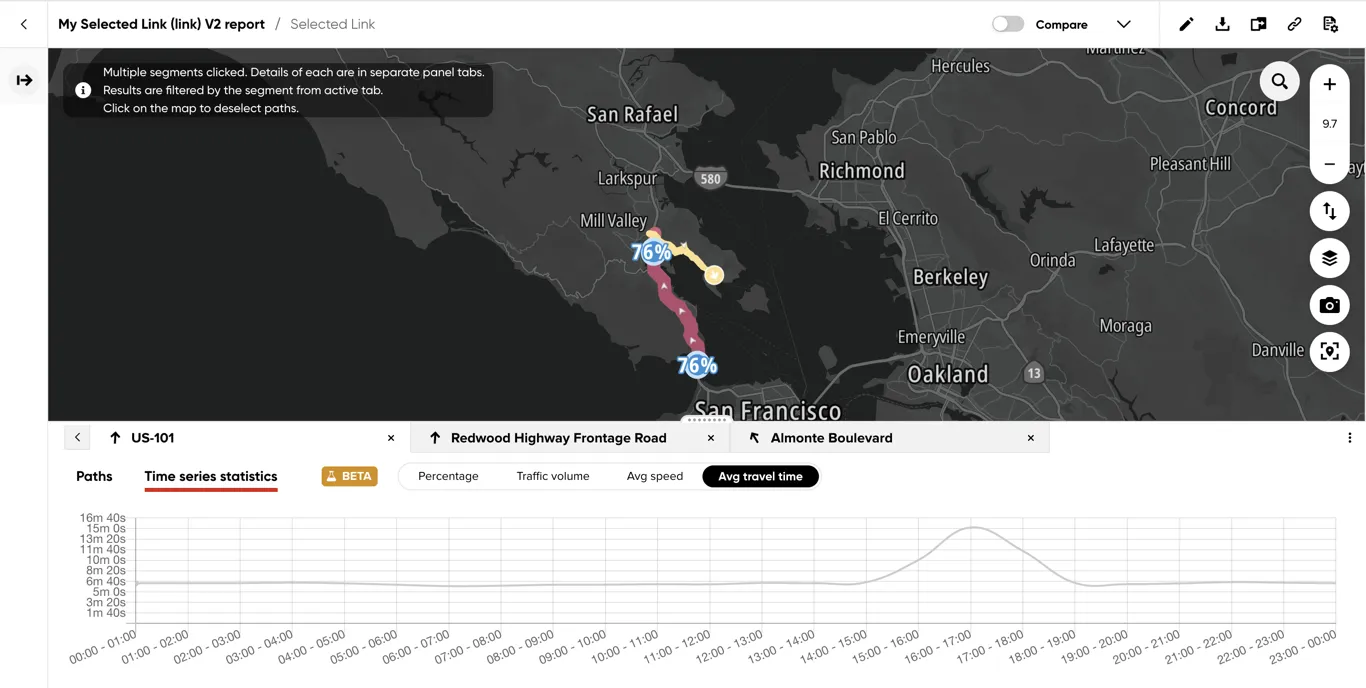
Average travel time shows the average time vehicles spent traveling along the path in each time range.
Map Area
Exploring the map
Hover over a result segment to highlight the paths between that segment and the selected link geometry. Click the segment to filter the visible tree to complete paths that contain it and open those paths in the Results Panel.
Compare maps
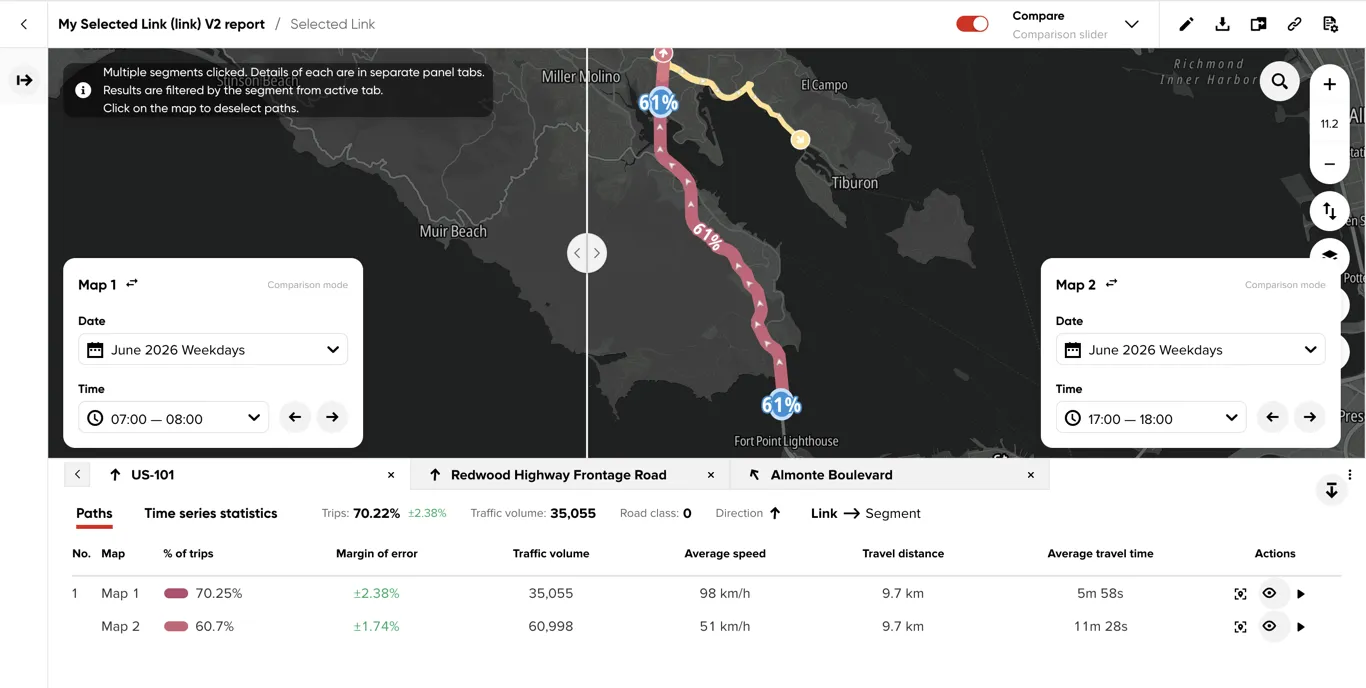
Compare is available when the report contains multiple date or time ranges. Turn on Compare, then use the dropdown to choose how the maps are arranged:
Side by side displays both maps next to each other.
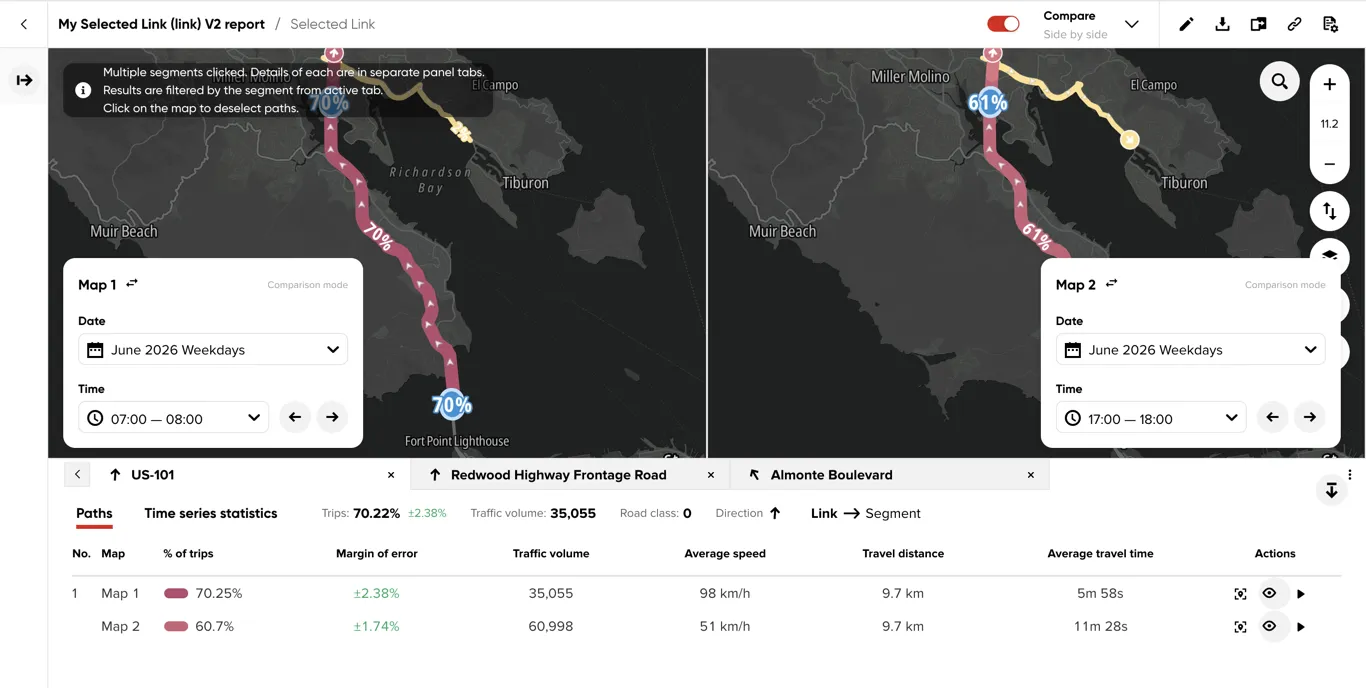
For every path, the table displays separate Map 1 and Map 2 entries with the values for the selected period on each map.

Comparison slider overlays the maps and reveals each one on the corresponding side of a movable divider. Drag the divider to change how much of each map is visible.
One on top of the other draws both results on the same map. Flip maps exchanges Map 1 and Map 2 without changing their selected periods, including which result is drawn on top.
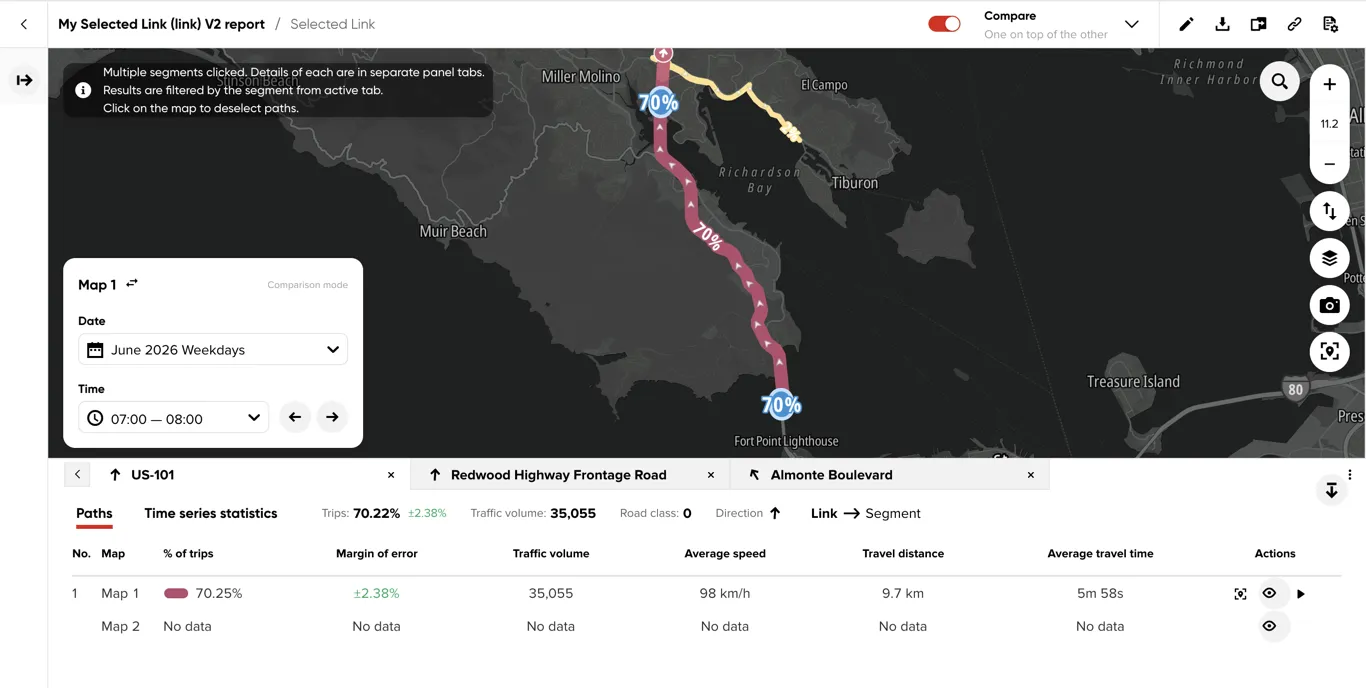
Each map has its own Date and Time controls, while trip direction, metric, and filter settings apply to both. Select different periods to compare the same result under the same settings. Selecting a segment pairs the corresponding Map 1 and Map 2 paths in the results table.