Overview
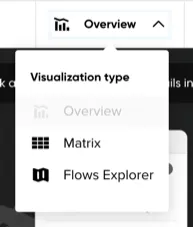
Once an accepted report is opened, it loads the results page. The Visualization type menu in the top bar switches between the three ways to review a Flow Matrix report: Overview, Matrix and Flows Explorer. Reports open on Overview by default.
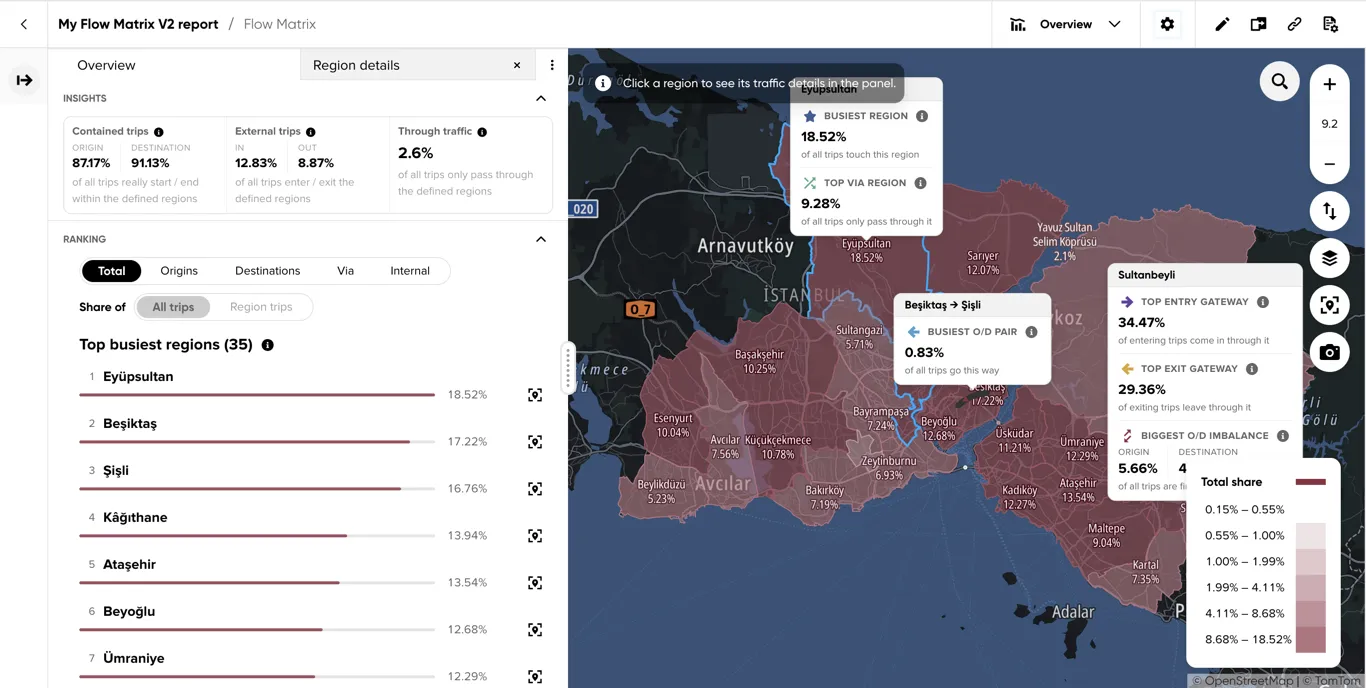
The Overview answers the first questions about an area before you drill into pairs of regions: how much of the traffic is local, how much only passes through, which regions carry the most trips and where trips enter and leave the analysis area.
See Viewing analysis results for common top bar actions, Date and Time controls, results panel placement, map controls, and legends.
How the overview is calculated
- First seen and last seen — a trip’s origin is the region it is first seen in and its destination the region it is last seen in. If the trip really started or ended inside your regions, that is where it starts or ends; if it started or ended outside, it is the region through which it entered or left the analysis area. The report also keeps track of whether the real start and end lay inside or outside the regions, which is what separates contained, external and through traffic below.
- How to read the percentages — every value is a share of trips for the selected date range and time range, and what it is a share of depends on where you look. Insight tiles and Region details use all trips analyzed unless their tooltip says otherwise (the entry and exit gateways are shares of entering or exiting trips). In the Ranking and on the map, the Share of option decides: All trips makes 100% all trips analyzed, Region trips makes 100% the trips interacting with each region, so 8% next to a region reads either as “8 of every 100 analyzed trips” or as “8 of every 100 trips touching this region”. Each date range and time range is its own 100%, so compare shares between ranges as proportions rather than adding them up.
Top Bar - Info & Actions
Common report actions are described in Viewing analysis results. Flow Matrix adds the following visualization-specific actions.
Visualization type
Switches between Overview, Matrix and Flows Explorer.
Layer settings
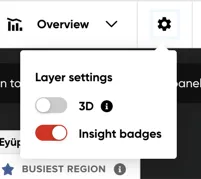
Opens a popover with two map-layer toggles:
- 3D — extrudes each region’s surface in proportion to its value; right-click-drag the map to tilt the view and see the extrusion. It only takes effect once a region is selected.
- Insight badges — shows or hides the on-map badges (busiest region, top entry/exit gateway, biggest O/D imbalance, busiest O/D pair). Turning badges off instead surfaces those same insights as tiles in the Insights section of the panel, alongside Contained trips, External trips and Through traffic.
Left Panel - Report Settings
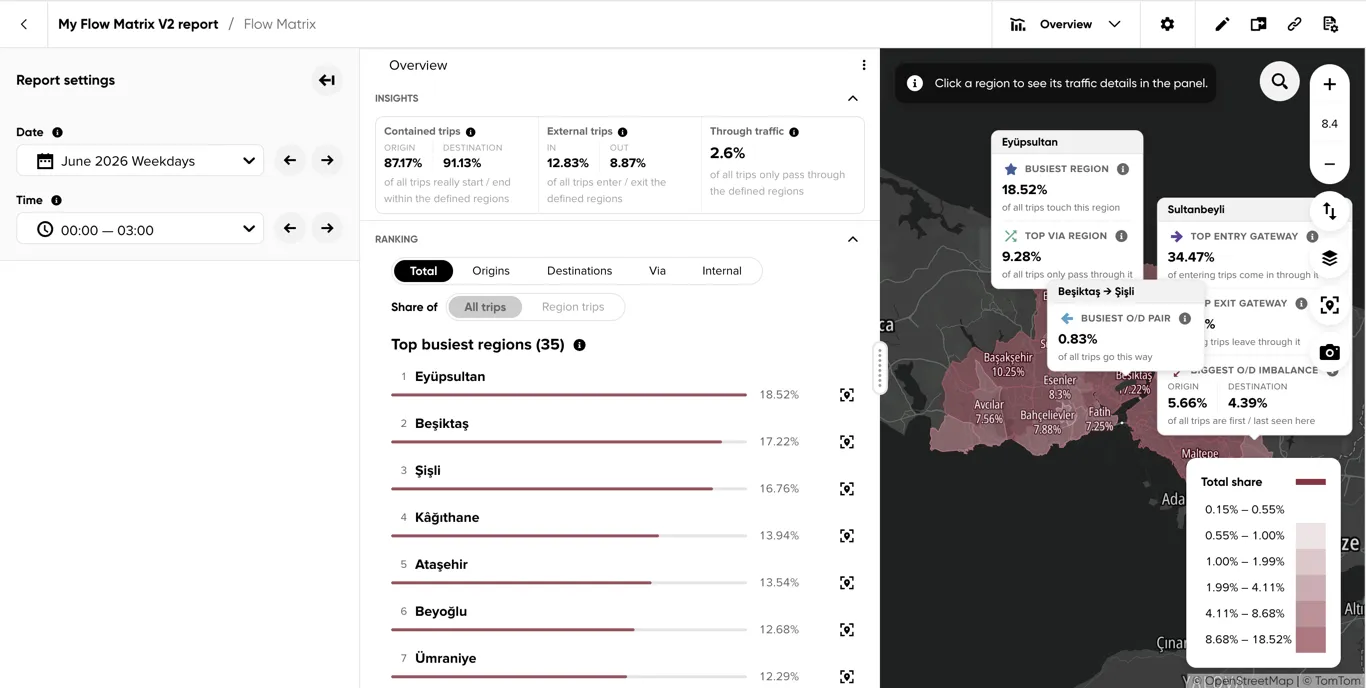
Date and Time
See Date and Time for the common selector mechanics, assignment rules, and information tooltips.
Results Panel
Panel tabs
The panel’s own top bar holds a tab for each open view — Overview by default, joined by Region details once a region is selected from the map. See Viewing analysis results for docking and default-layout options.
Insights
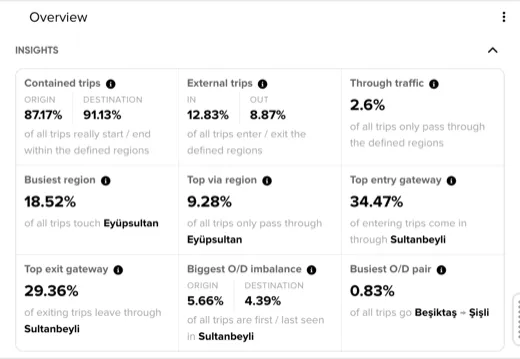
The Insights section summarizes the whole report:
- Contained trips — origin and destination shares: the share of trips with a real start (origin) or end (destination) point inside the defined regions. A trip that both starts and ends inside contributes to both values; each percentage is out of all trips analyzed.
- External trips — in and out shares: the share of trips with a real start point outside the regions that enter the analysis area (in), or a real end point outside that leave it (out). A trip that does both contributes to both values.
- Through traffic — the share of trips with both a real start and a real end point outside the defined regions, only passing through the analysis area.
- Busiest region — the region with the highest number of trips that start there, end there, or pass through it, out of all trips analyzed.
- Top via region — the region with the highest number of trips passing through it without being first or last seen in it, out of all trips analyzed. Only shown when via data is available.
- Top entry gateway — the region with the highest number of entering trips (a real start point outside the defined regions, first seen in this region), out of all entering trips.
- Top exit gateway — the region with the highest number of exiting trips (a real end point outside the defined regions, last seen in this region), out of all exiting trips.
- Biggest O/D imbalance — the region with the largest difference between trips first seen there (origins) and trips last seen there (destinations). More origins indicate a trip generator, more destinations a trip attractor.
- Busiest O/D pair — the origin-destination pair with the highest number of trips, regardless of the route taken between them, out of all trips analyzed.
These last six are region- or pair-specific, so they normally show as badges directly on the map (see Results layer) instead of as tiles here — they only appear as tiles when the Insight badges map layer is turned off.
How to read the first three tiles together:
- Contained origin share and External in share add up to 100%, and so do contained destination share and External out share: every trip either really started inside the regions or entered from outside, and either really ended inside or left to outside.
- Through traffic is part of both External in and External out, so it is not a third slice next to them. External in minus Through traffic gives the trips that came from outside and ended inside; External out minus Through traffic gives the trips that started inside and left.
- A high Through traffic share means the regions sit on a corridor, or that the analysis area is smaller than the trips it captures; extend the regions if you want to see where those trips really start and end. A high contained share means the regions cover the trips well and the Matrix and Flows Explorer describe genuine local traffic.
- For Biggest O/D imbalance, a region with clearly more origins than destinations sends out more trips than it receives in the selected time range (a residential area in the morning), and the reverse marks an attractor (a business district in the morning). Compare the morning and evening time ranges to see the roles swap.
Ranking
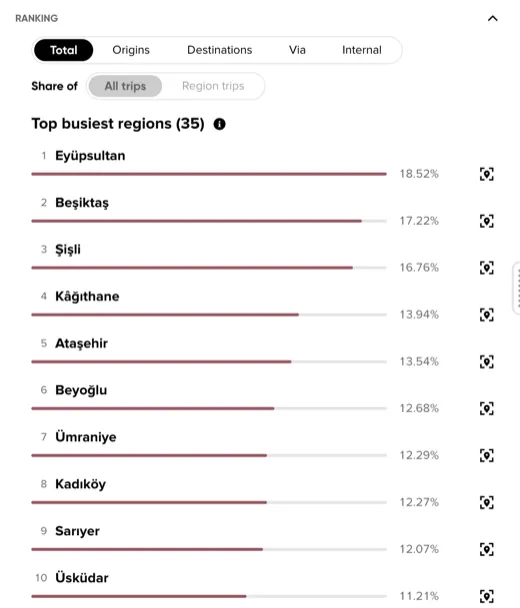
The Ranking section lists regions ordered by their share of trips.
- Total / Origins / Destinations / Via / Internal — ranks regions by that role:
- Total — trips that interact with the region: trips first seen in it, last seen in it or passing through it, each trip counted once per region. Answers “which regions carry the most traffic?”.
- Origins — trips first seen in the region, including trips that entered the analysis area through it. Across all regions these shares add up to 100%.
- Destinations — trips last seen in the region, including trips that left the analysis area through it. Across all regions these shares add up to 100%.
- Via — trips passing through the region without being first or last seen in it. A trip is counted in every region it crosses, so these shares overlap. Via only appears for analyses with a via dimension, and is disabled when only aggregate data is available.
- Internal — trips observed only within the region, first and last seen there. A high share marks a region whose traffic is mostly local, or a region large enough to hold whole trips.
- Share of: All trips / Region trips — changes what the percentages are relative to. With All trips, 100% is all trips analyzed, so regions are compared by volume. With Region trips, 100% is the trips interacting with each region, so the value says what part of a region’s own traffic plays that role: 60% under Origins means that 60 of every 100 trips touching the region start there. Use it to compare the character of regions of very different size. Locked to “All trips” when the metric is Total, because every region’s total is by definition 100% of its own trips.
Each row is a horizontal bar sized relative to the top region, not to 100%, with a target icon to zoom the map to that region. The list shows the ten highest regions with a link to show all.
Region details
Clicking a region on the map opens a second Region details tab for it, with its own close button to deselect and return to Overview.
-
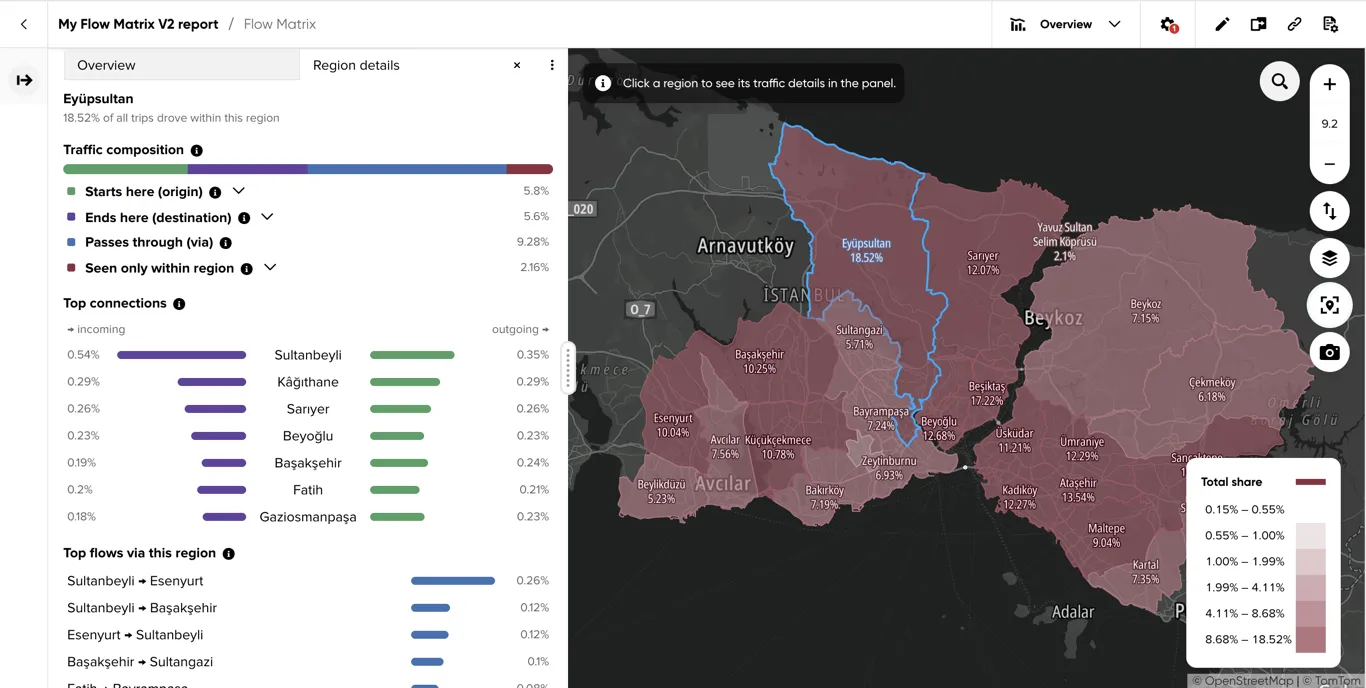
Header — the region’s name and the share of all trips analyzed that interact with it (the same value as Total in the Ranking).
-
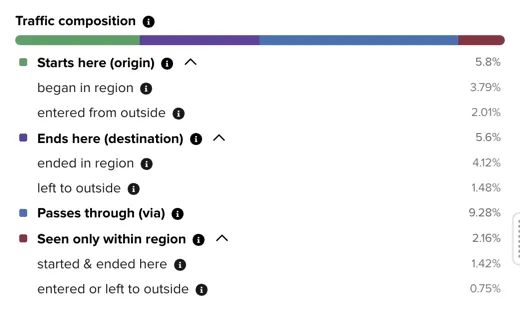
Traffic composition — a breakdown of trips touching the region by role, each value a share of all trips analyzed:
- Starts here (origin) — trips first seen in the region, split into began in region (real start inside it) and entered from outside (real start outside the defined regions, entered through this one).
- Ends here (destination) — trips last seen in the region, split into ended in region and left to outside.
- Passes through (via) — trips crossing the region without starting or ending in it; shown only when via data is available.
- Seen only within region — trips first and last seen in this region, split into started & ended here (both real ends inside) and entered or left to outside (trips that only touched this region on their way in or out of the analysis area).
The sub-rows add up to their parent row. The four main rows do not add up to the header value, because trips seen only within the region are counted both as starting and as ending here; the stacked bar above the rows shows their proportions to each other. A region whose origin and destination rows are dominated by “entered from outside” and “left to outside” is a gateway rather than a place where trips really begin or end.
-
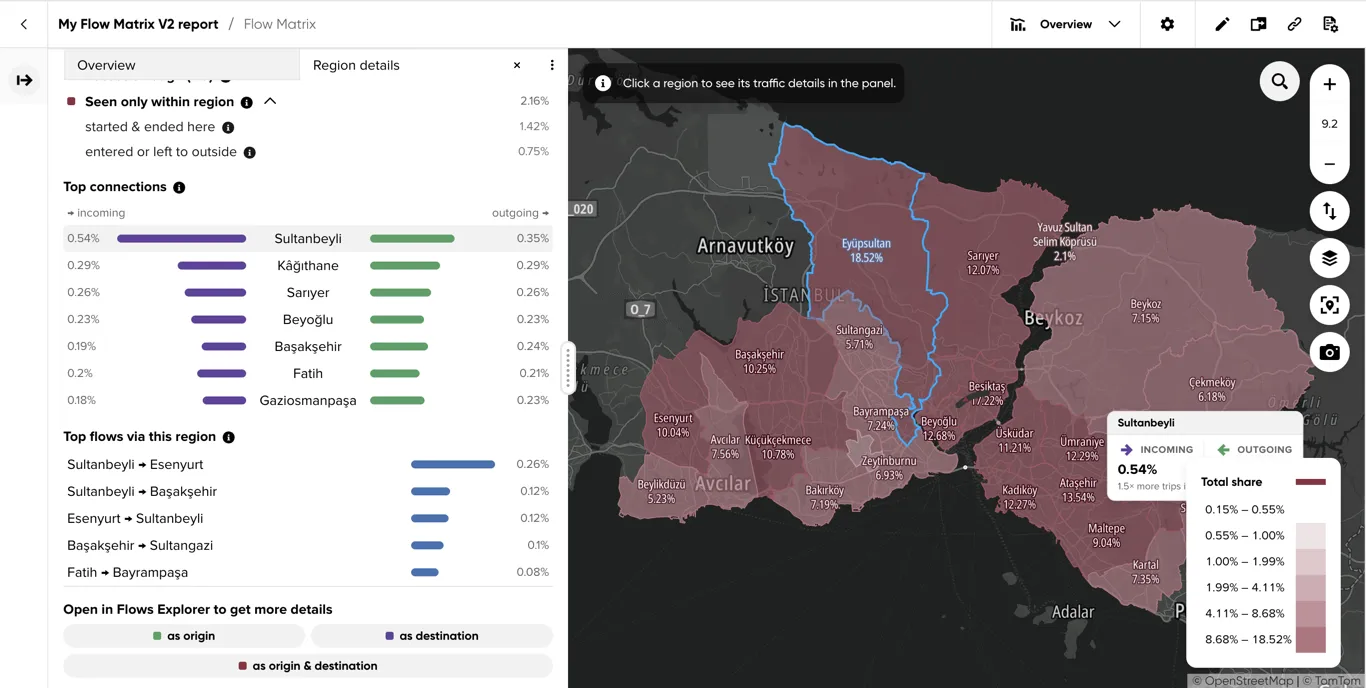
Top connections — the seven partner regions exchanging the most trips with this one. Incoming is the share of all trips analyzed that went from the partner to this region, outgoing the share that went from this region to the partner, regardless of the route in between. A strong asymmetry between the two, in one time range, is the same generator-versus-attractor pattern as the O/D imbalance insight. Click a row to zoom to the partner region.
-
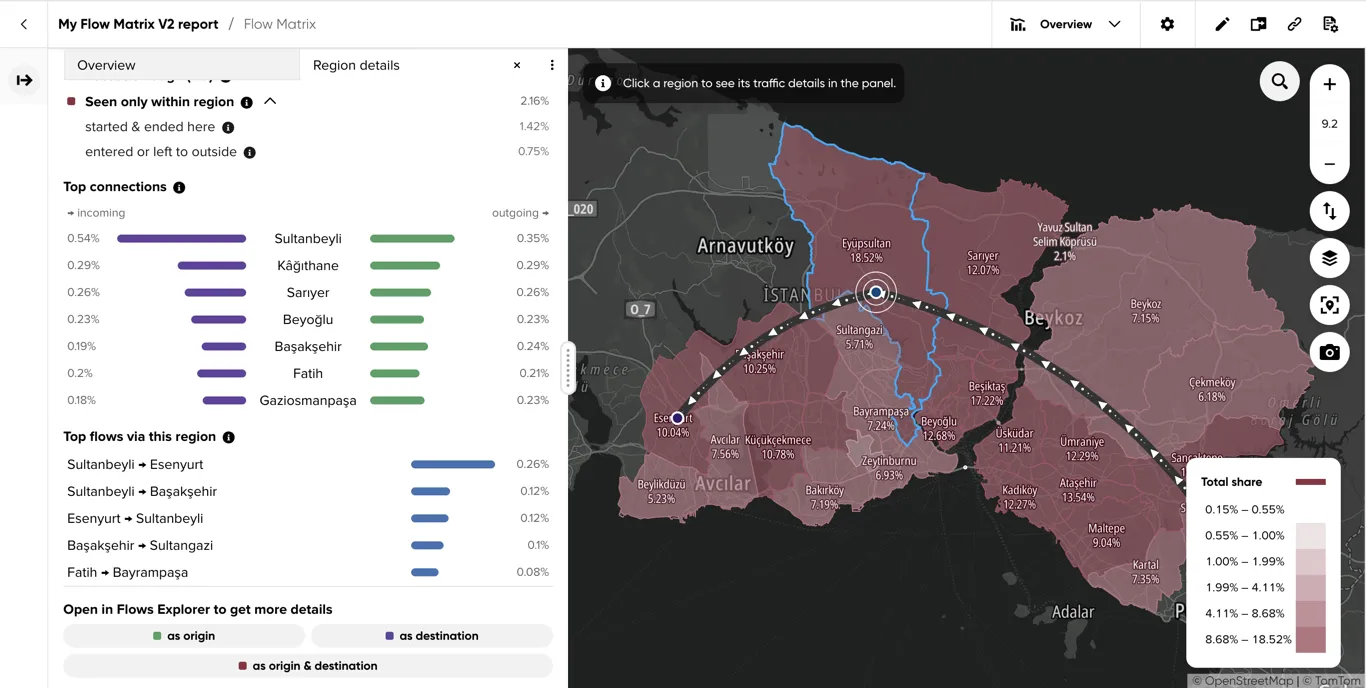
Top flows via this region — the five origin-destination pairs with the most trips passing through this region without starting or ending in it, as shares of all trips analyzed. This is where the region’s through traffic comes from and goes to. Click a row to zoom to both regions.
Hovering a row in Top connections highlights the partner region on the map and shows its incoming and outgoing shares, with a one-line balance such as “2.3× more trips incoming” or “Incoming and outgoing trips are similar”:
Hovering a row in Top flows via this region animates the flow between its origin and destination on the map:
- Open in Flows Explorer — three buttons (as origin, as destination, as origin & destination) that switch to Flows Explorer with this region pre-selected in the matching role.

Map Area
Common controls and legend behavior are described in Viewing analysis results.
Helper text and region coloring
A helper message in the top-left corner reads “Click a region to see its traffic details in the panel.” (visible in the screenshot at the top of this page). The map colors every region by the same value the Ranking shows for it — the selected metric under the selected Share of option — so switching the metric from Total to Via, or the reference to Region trips, recolors the map. Colors are relative to the lowest and highest value currently on the map, in six steps; a dark region is high compared with the other regions of this report, not above a fixed threshold. Regions with no trips are drawn grey with a “No data” label. With 3D enabled, regions are extruded proportionally to the same value, the highest region always reaching full height.

Results layer
When Insight badges are on, each region and region pair shows its relevant insights directly on the map (busiest region, top via region, top entry/exit gateway, biggest O/D imbalance, busiest O/D pair), each with its own share and an info tooltip explaining it. Clicking a single-region badge selects that region and opens its Region details tab; clicking a pair badge zooms to both regions.