Region results
A Selected Link region report analyzes traffic crossing a polygon. In addition to incoming and outgoing traffic, it can show Inside trips that enter and leave the region.
For common top-bar actions, Date and Time selector mechanics, results-panel placement, map controls, and the legend, see Viewing analysis results.
How region results are calculated
Region results are built the same way as link results — a tree of road segments, percentages with a margin of error, estimated traffic volume, cumulative travel time and distance — so How link results are calculated applies here too. The differences are where the trees start and what 100% means.
- Entrances and exits — a trip’s entrance is the road segment on which it first crosses into the region, and its exit the segment on which it last leaves it. Only segments of the road classes chosen with Select exits/entrances by road classes when creating the report count as entrances or exits. A trip crossing the boundary on a road of another class is not counted. The moment the trip enters the region decides its date range and time range.
- Three results from one trip — Incoming follows the trip backwards from its entrance, so every entrance is the root of its own tree and the Top entrances table adds up to about 100% of the trips entering the region. Outgoing follows the trip forwards from its exit. The Top exits table adds up to about 100% of the trips leaving. Inside is the route from entrance to exit within the region and covers only trips that both entered and left it.
- How to read the percentages — in Incoming and Outgoing, a value is the share of all trips entering (or leaving) the region that used this entrance (or exit) and, for deeper segments, this exact route to it. In Inside, a value is the share of all inside trips that took this exact entrance-to-exit route. When a single segment is selected in Inside, the percentages switch to the distribution of the trips passing through that segment, so they add up to 100% for that segment. Each date range and time range is its own 100%.
- Trips with an unknown exit — a trip that entered the region but whose exit could not be determined is counted in Incoming only. This happens when the trip ended inside the region, when its GPS trace broke off inside (a processing failure), or when it left on a road class not selected as an exit. Such a trip appears neither in Outgoing nor in Inside, which covers only trips that both entered and left the region through counted entrances and exits. The mirror case, a trip that started inside the region, is counted in Outgoing only.
- Travel time and distance — cumulative along the path and including the entrance or exit segment itself. For Incoming they run from the start of the segment to the entrance, for Outgoing from the exit to the end of the segment, and for Inside from the entrance to the exit.
- Traffic volume — an estimate of the real number of vehicles, not a count of observed trips. Each entrance and exit gets its own estimate, from a model trained on road traffic counters, for its own road segment over the analyzed days and hours. That estimate is then distributed down the entrance’s or exit’s tree in the same proportions as the trips. An entrance or exit without volume coverage shows no volume for itself or any route through it. These are the points marked with a warning icon when the report is created. See Historical Traffic Volumes for how the estimate is produced and where it is available.
Top Bar - Info & Actions
Selected Link provides the following result-specific top-bar actions.
Compare
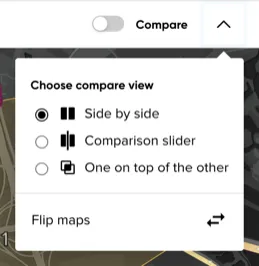
Opens the same comparison menu described in Link results — see Compare maps for the available layouts and Comparing Inside trips for the Region workflow.
Download results
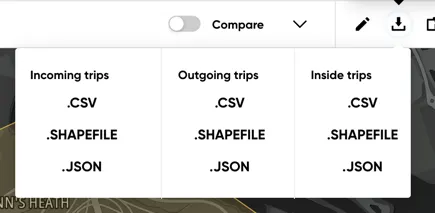
Downloads the complete Incoming trips, Outgoing trips, or Inside trips result for the selected Date and Time range as CSV, Shapefile, or JSON. The export is independent of the active Color and labels unit and map filters.
Each row or feature represents a road segment. Its Id and Parent id define the segment tree; the remaining fields contain all available data, including percentage, margin of error, functional road class, geometry, processing failures, privacy trims, average travel time, travel distance, traffic volume, and road name. The JSON file also contains report metadata, while the Shapefile archive includes it as metadata.xml.
Left Panel - Report Settings
Date and time
See Viewing analysis results for the common selector mechanics. In Compare mode, each map has separate Date and Time selectors.
The info icon next to each label explains how trips are assigned:
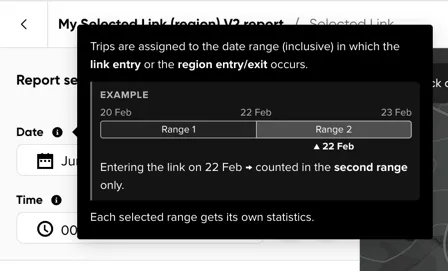
- Date — trips are assigned to the inclusive date range in which the region entry or exit occurs. For example, an entry on 22 February is counted only in the range containing 22 February. Each selected range gets its own statistics.
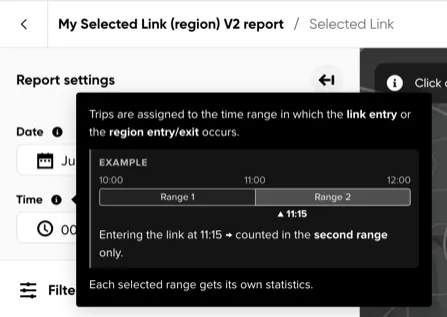
- Time — trips are assigned to the time range in which the region entry or exit occurs. For example, an entry at 11:15 is counted only in the range containing 11:15. Each selected range gets its own statistics.
Filters
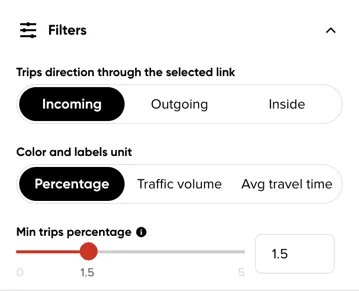
Trips direction through the selected region
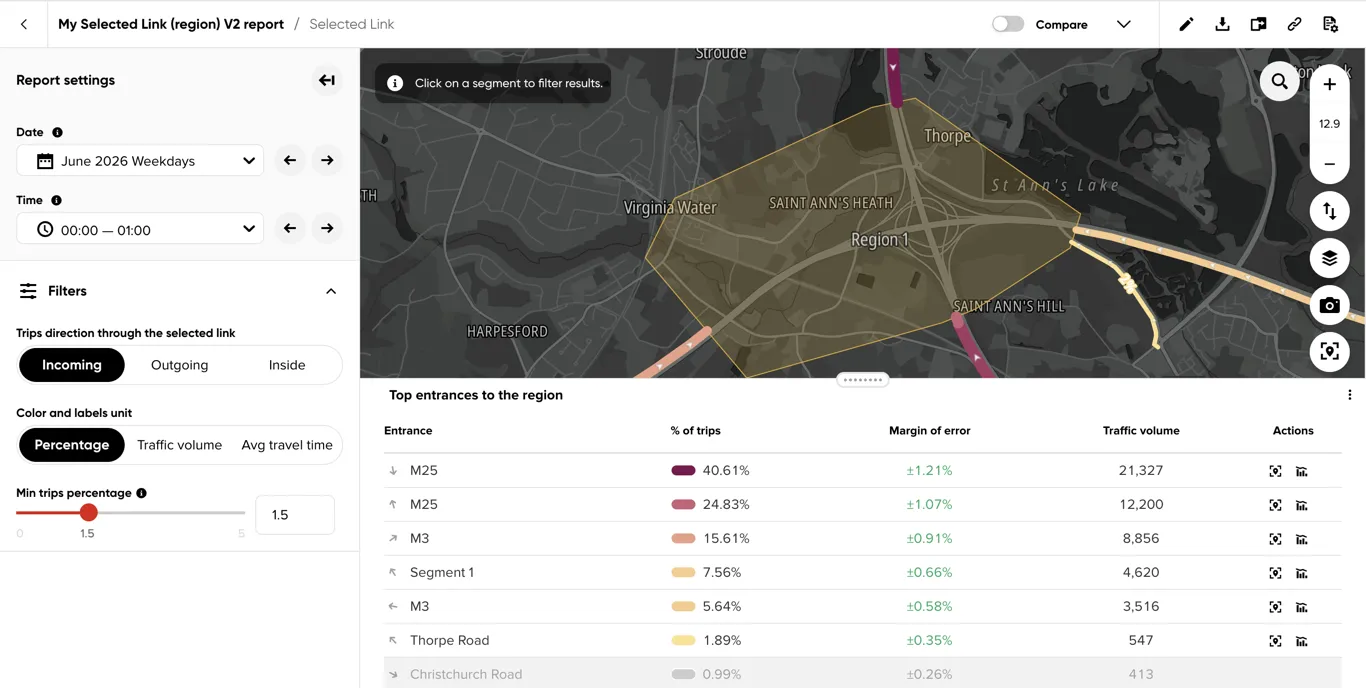
- Incoming shows the road segments traveled before trips enter the selected region.
- Outgoing shows the road segments traveled after trips leave the selected region.
- Inside shows trips that enter and leave the selected region.
Color and labels unit
This selector determines how paths are colored and labeled. The available options depend on the Enhanced metrics enabled when the report was created:
- Percentage is always available and shows the sampled trip share and margin of error.
- Traffic volume is available only when Traffic volume was enabled and shows the estimated total vehicle volume.
- Average travel time is available for Incoming and Outgoing results only when Travel time & distance was enabled.
Thresholds
- Min trips percentage hides segments representing less than the selected percentage of trips.
- Min volume is shown when Traffic volume is selected and hides segments whose estimated traffic volume is below the selected value.
- Max travel time (min) is shown when Average travel time is selected. For Incoming results, each visible path extends only as far as segments from which the trip to the selected region takes no more than the selected time. For Outgoing results, it extends only as far as segments that can be reached from the selected region within that time. Segments beyond the limit are hidden.
Inside results do not show threshold controls. Drag a threshold slider or enter its value in the field beside it; the map, labels, color scale and table update together.
Incoming and Outgoing Trips
Incoming
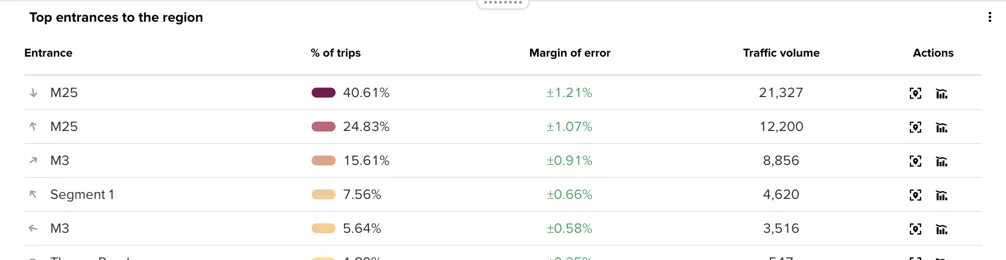
Incoming shows the road segments traveled before trips enter the selected region. The default results panel ranks entrances by their share of trips and includes the margin of error, traffic volume and available path actions. Each share is out of all trips entering the region, so the table answers “through which roads does traffic come in, and in what proportions?”. The volume column gives each entrance’s estimated number of vehicles.
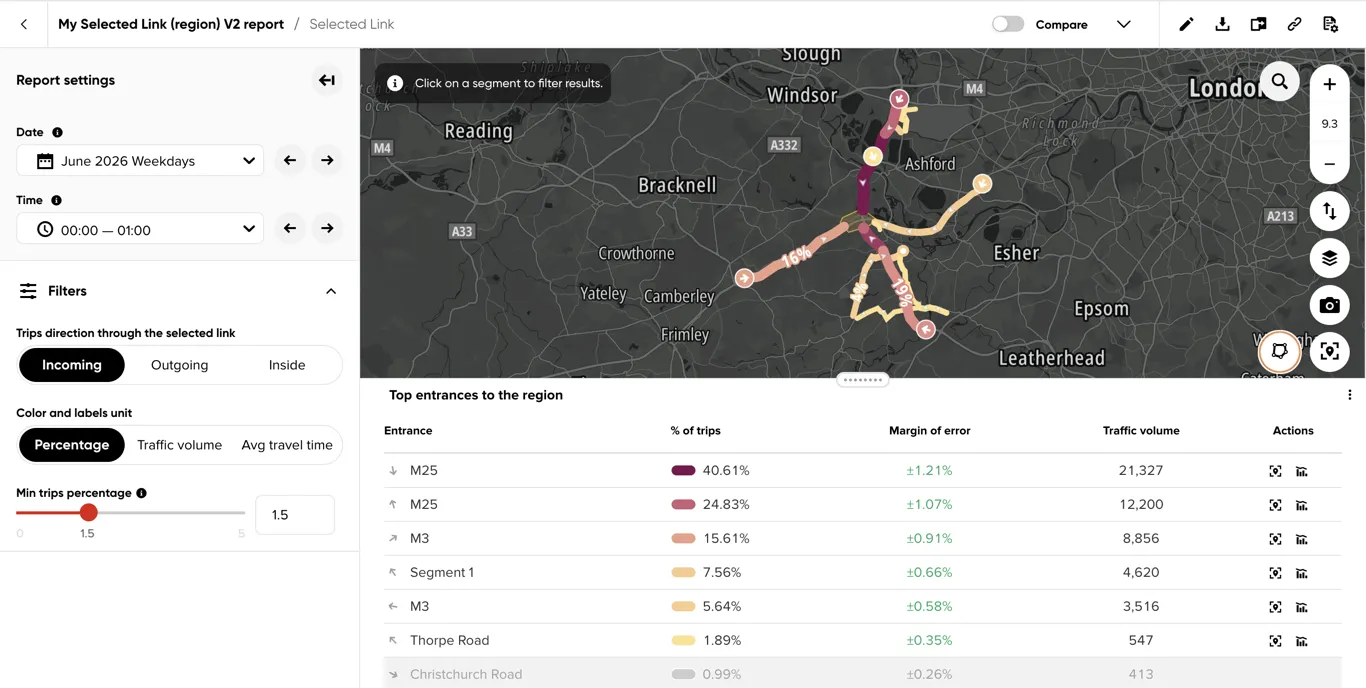
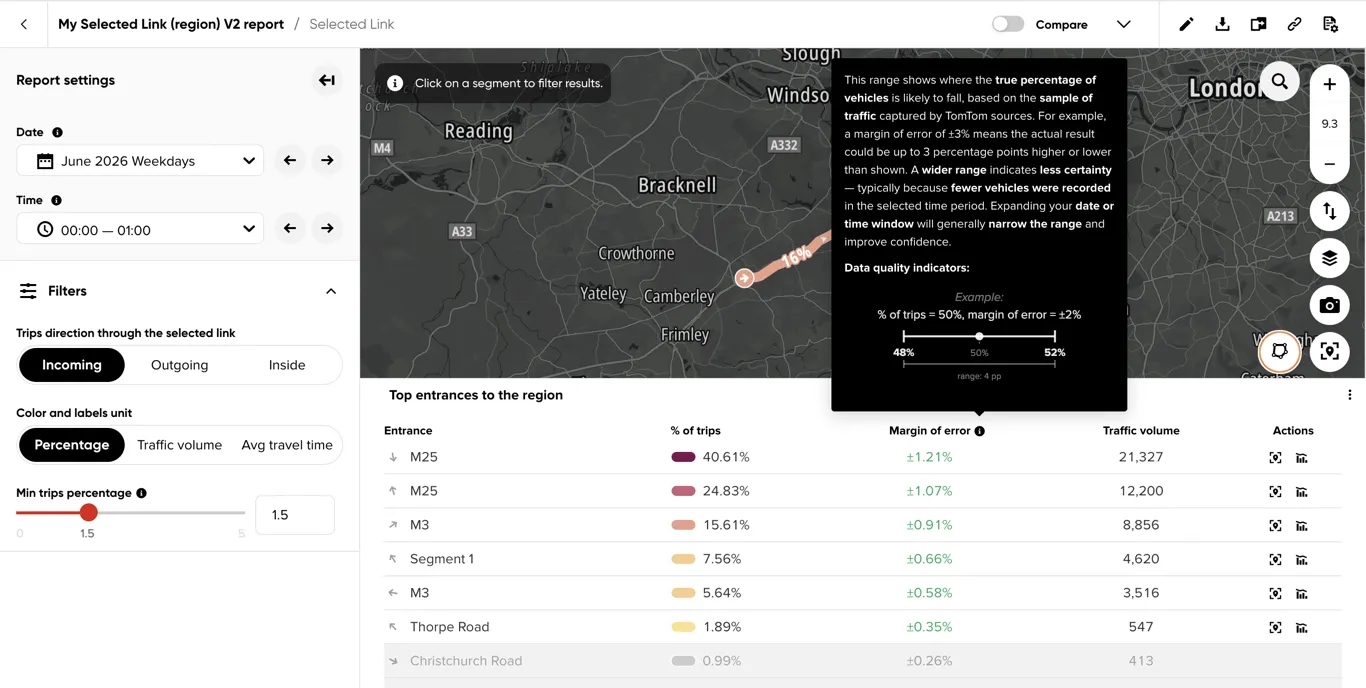
Hover the information icon beside a column heading to learn what that column represents. Read these descriptions in context: they adapt to the current trip direction, panel view and aggregation mode. For example, Margin of error explains the uncertainty range around the displayed trip percentage.
Outgoing
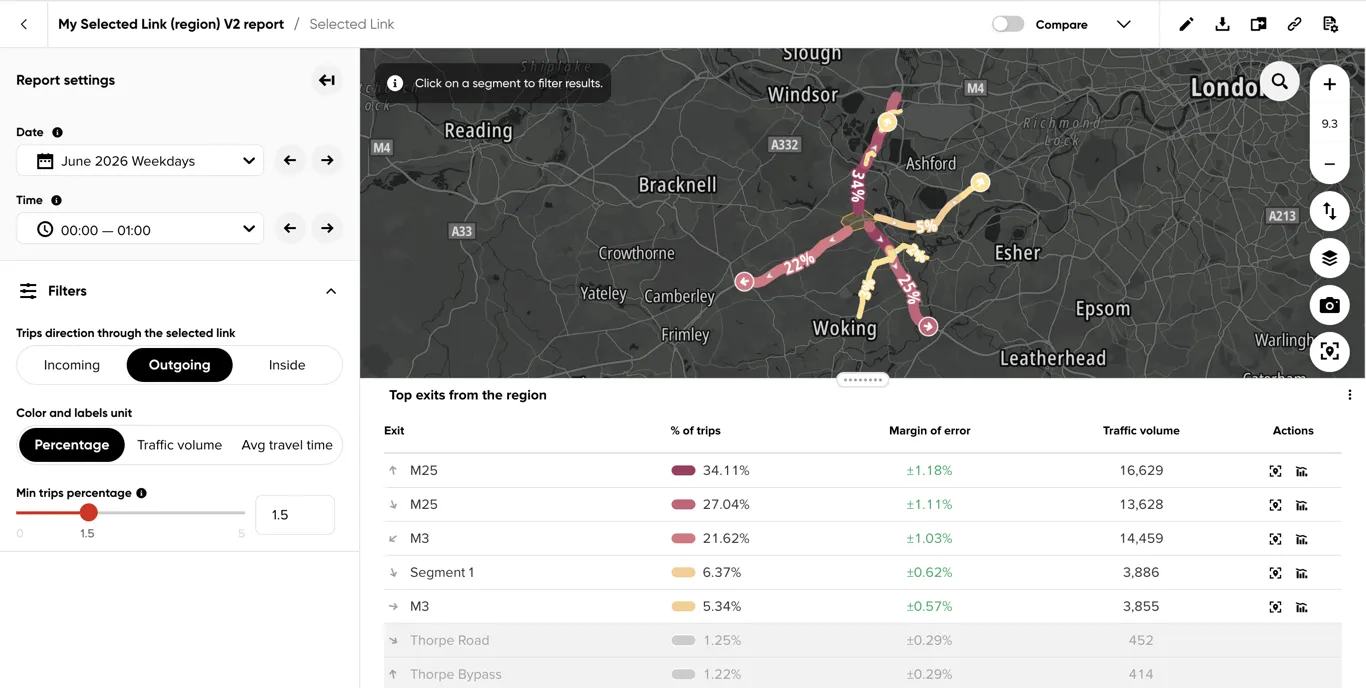
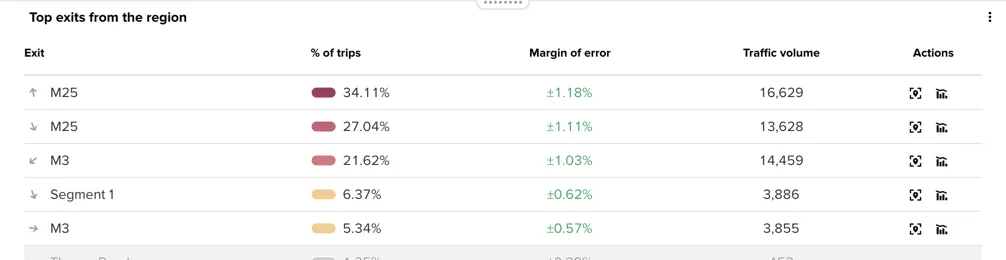
Outgoing shows the road segments traveled after trips leave the selected region. The results panel ranks exits instead.
Paths and Time Series
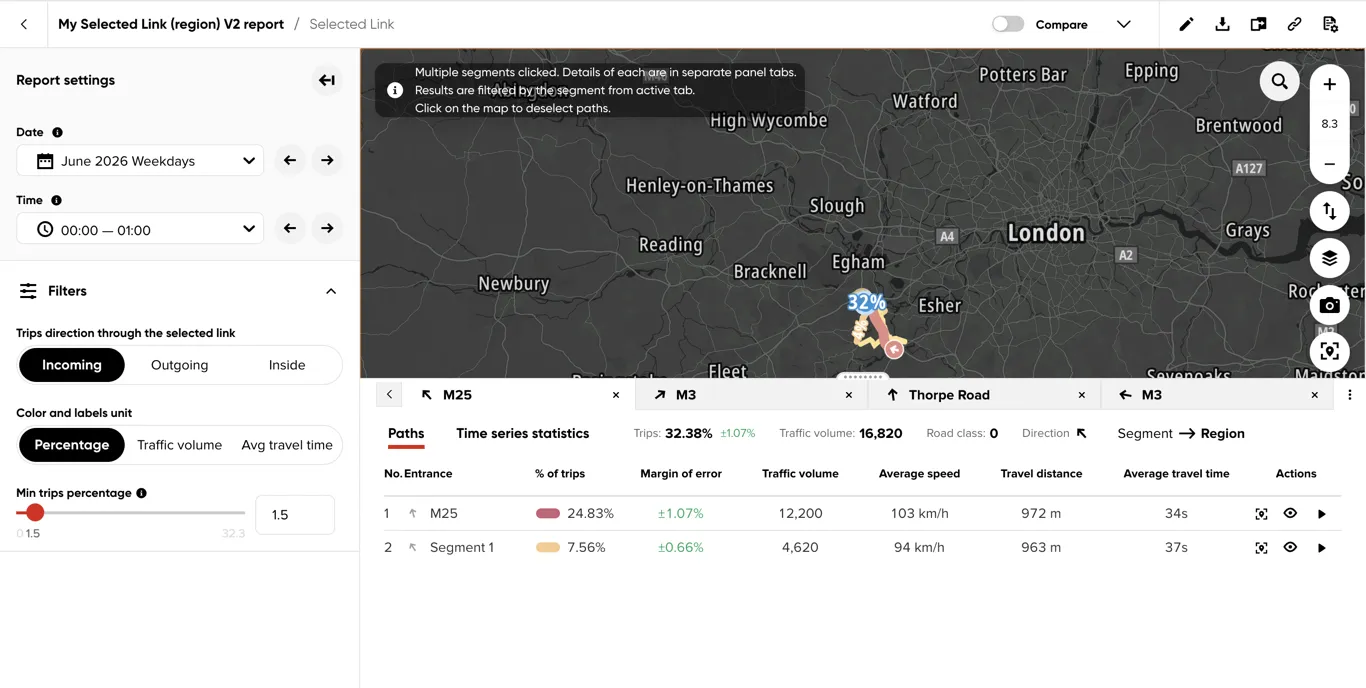
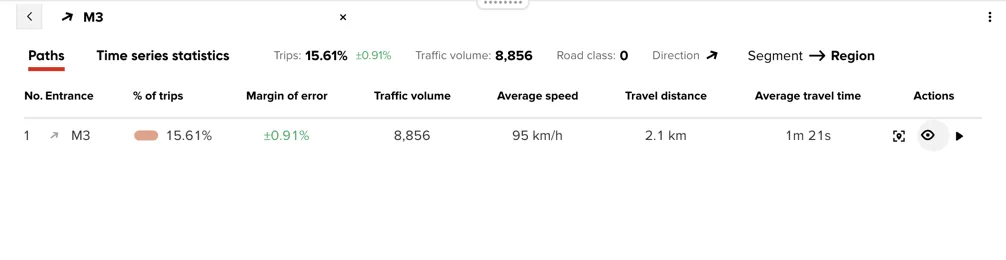
Select a segment on the map, or use the chart action for an entrance or exit, to open detailed results for that segment.
Paths
The Paths view lists every complete route that contains the selected segment. Its columns and row actions work as described in Paths in Link results.
Time series
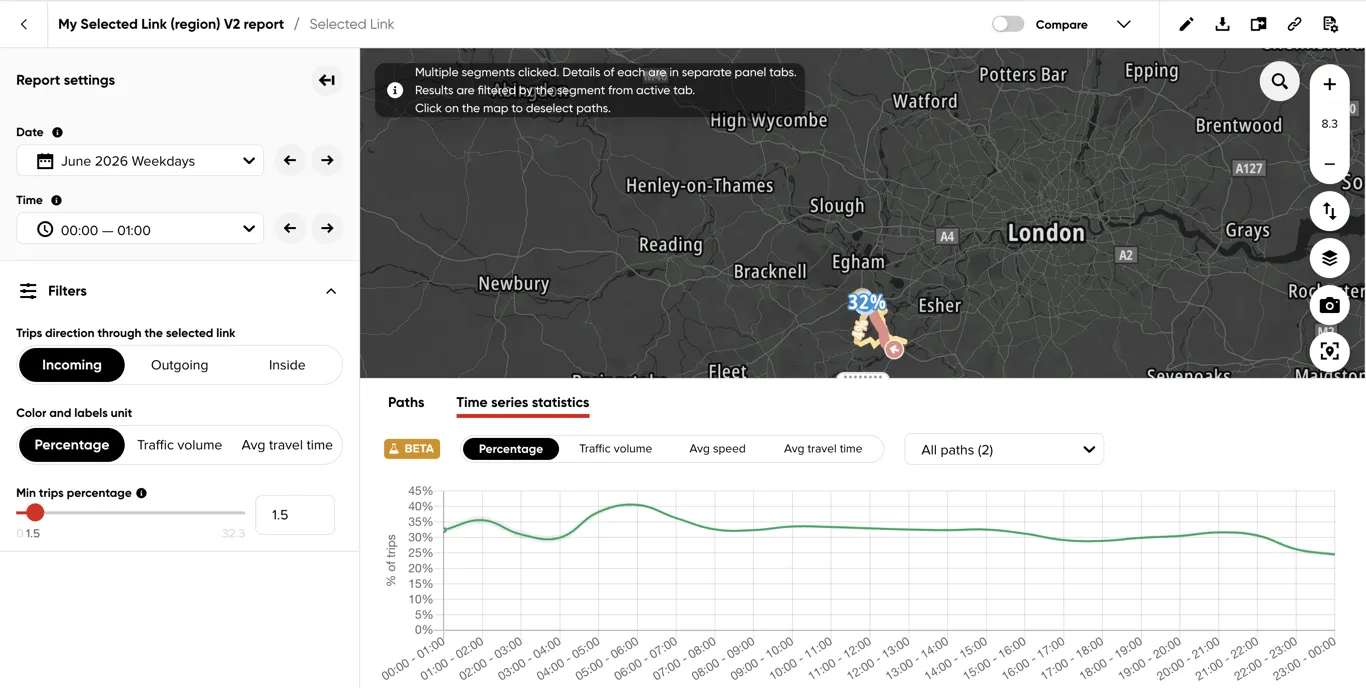
The Region time-series view works as described in Time series in Link results.
Route animation
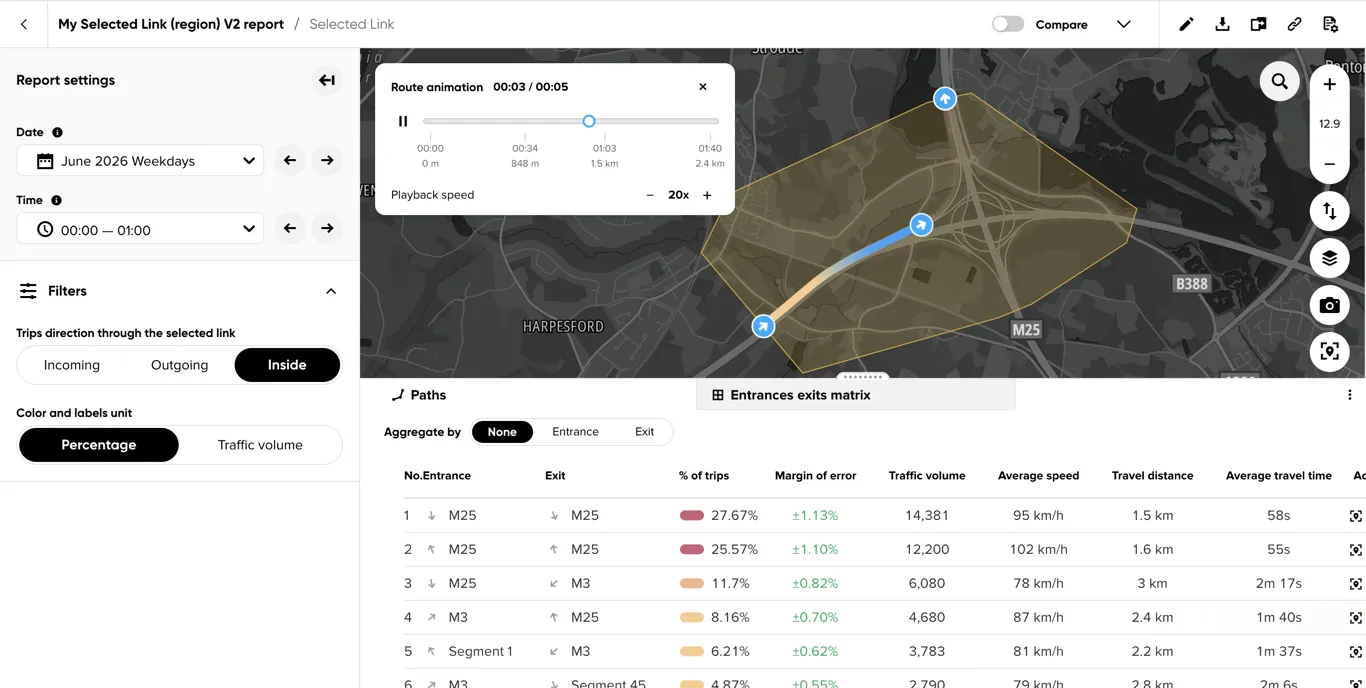
Route playback uses the controls described in Route animation in Link results. The example below animates an Inside entrance-to-exit route.
Inside Trips
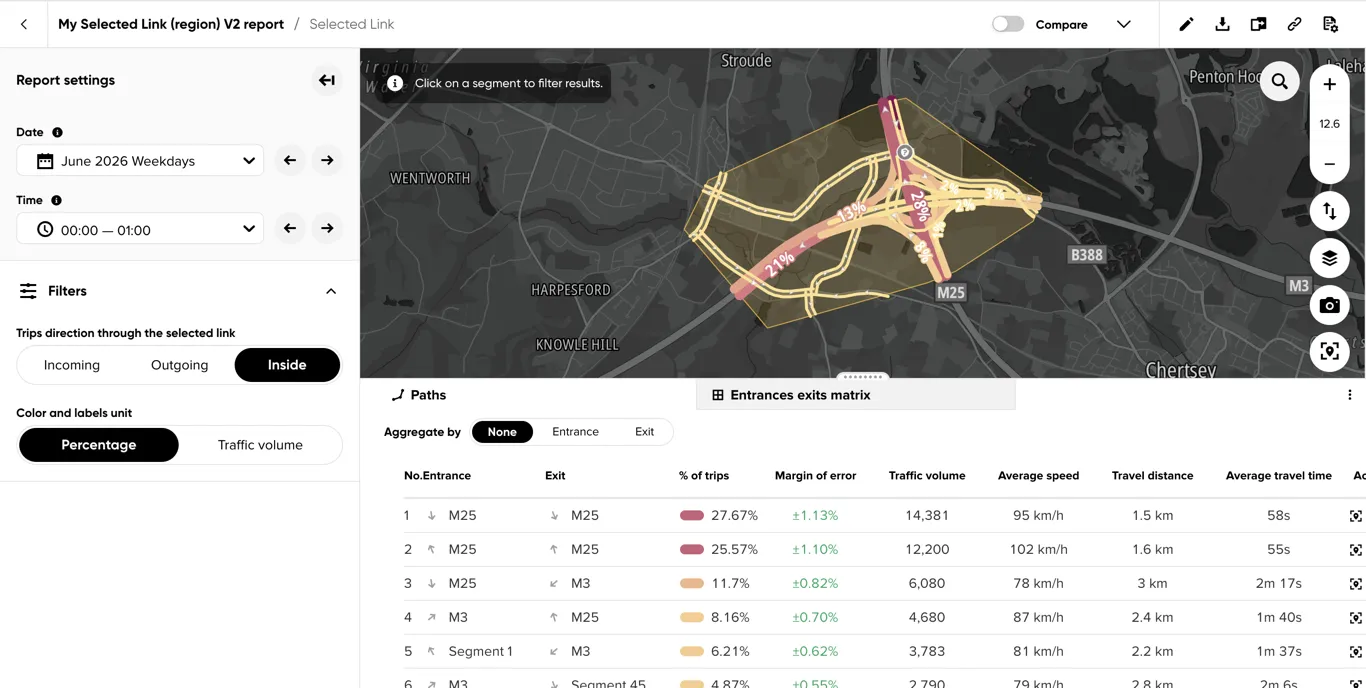
Inside shows trips that pass through the region from an entrance to an exit. Inside results provide two panel views.
Paths
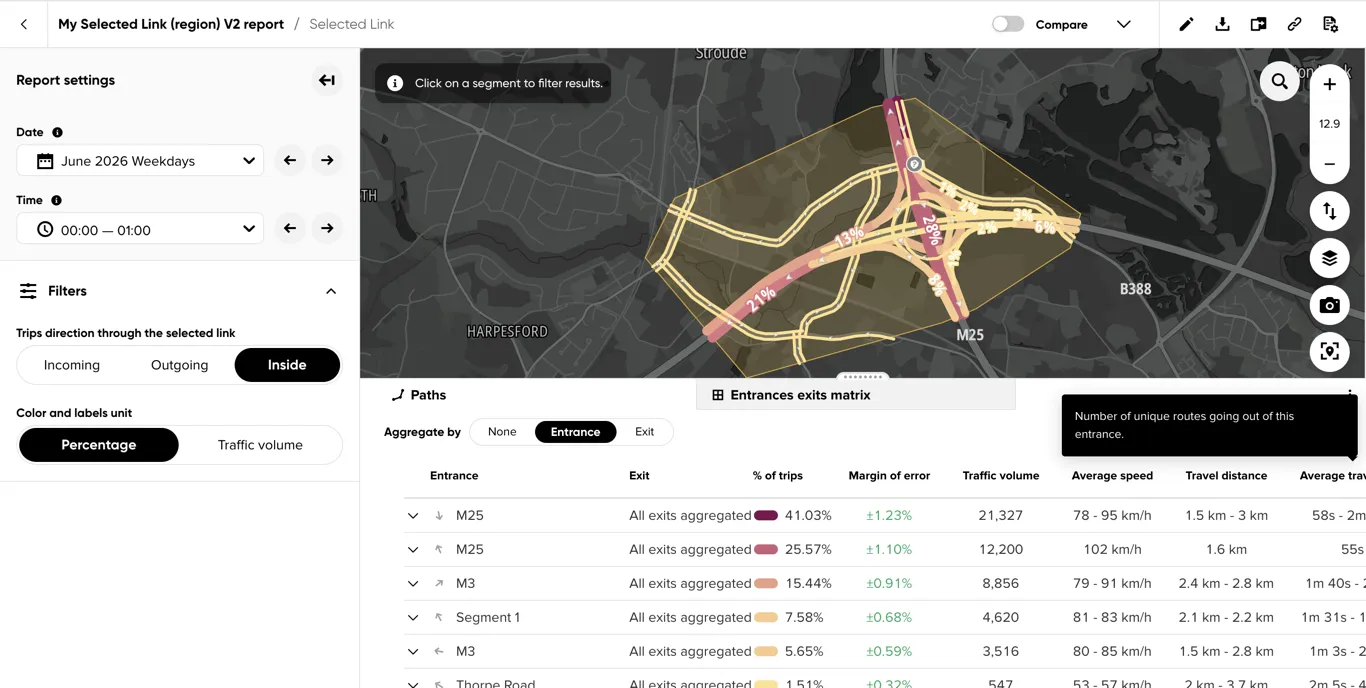
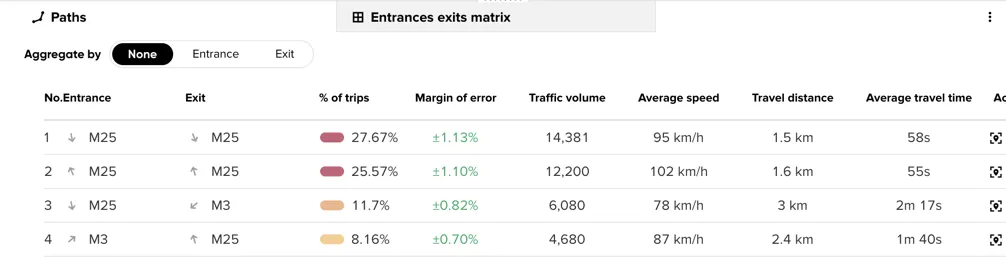
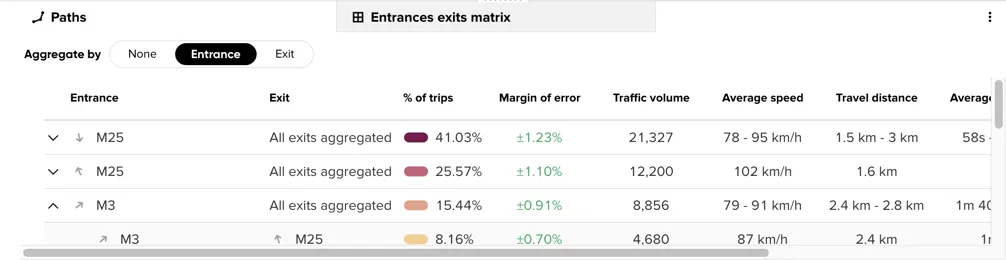
The Paths tab lists complete entrance-to-exit paths. Aggregate by can show every path separately or group the table by entrance or exit. Expand a group to inspect its individual paths.
How to read the values:
- With no aggregation, % of trips is the share of all inside trips that took exactly this route. Two rows with the same entrance and exit are different routes between them.
- Aggregated by Entrance, a row adds up every route from that entrance, so it is the share of inside trips that entered there, regardless of exit. Aggregated by Exit, it is the share that left there. Travel time, distance and speed of an aggregated row are shown as the range from the fastest to the slowest route.
- Traffic volume is the estimated number of vehicles for the same set of trips. Routes from the same entrance share that entrance’s estimate in proportion to their trips.
Some Inside results include additional indicators:
- A privacy-trim icon beside an entrance or exit means that privacy rules required the trip endpoint to be shortened to that segment. Hover the icon to see its explanation.
- An information icon beside a value provides a breakdown of trips whose exit could not be determined, including privacy trimming, processing errors and trips that ended before leaving the region.
- No unique routes appears when results are aggregated by Entrance or Exit. It counts the distinct complete routes represented by that aggregated row; hover its column-header information icon for the direction-specific definition.
Entrances exits matrix
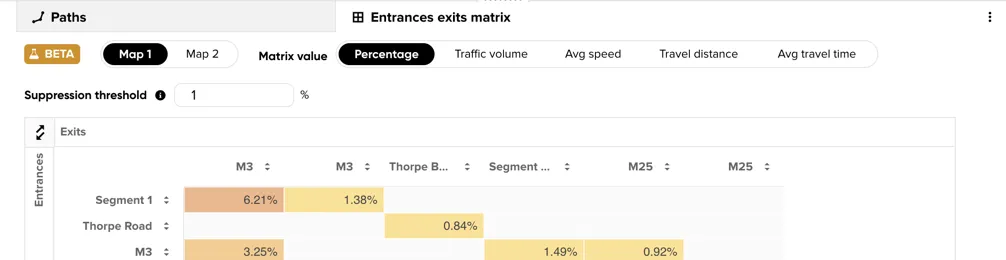
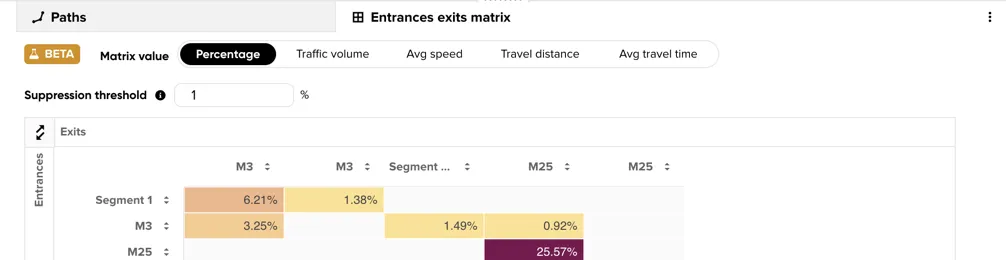
The Entrances exits matrix summarizes traffic from each entrance to each exit. Choose the matrix value, set a suppression threshold to hide low-value rows and columns, sort an axis, or swap entrances and exits. Hovering a row, column or cell highlights the corresponding paths on the map. Clicking a cell opens its detailed paths.
A cell combines every route between its entrance and exit. With Percentage or Traffic volume selected, the cell is the sum over those routes, so it is the share of all inside trips (or the estimated vehicles) going from that entrance to that exit by any route, and the whole matrix adds up to about 100% of the inside trips. With Avg travel time, Travel distance or Avg speed, the cell is the average over those routes. Cell colors are relative to the highest cell in the matrix. A blank cell means no trip was observed between that entrance and exit.
The Suppression threshold uses the currently selected matrix unit. It hides every entrance row and exit column whose cells are all empty or below the threshold. A row or column remains visible when at least one of its cells meets or exceeds the threshold. In Compare mode, values from both maps are considered so the same rows and columns remain visible when switching between Map 1 and Map 2.
Comparing Inside trips
Turn on Compare while viewing Inside trips to compare entrance-to-exit paths across two Date and Time combinations. The map selectors choose each period, and the table pairs the corresponding Map 1 and Map 2 path values.
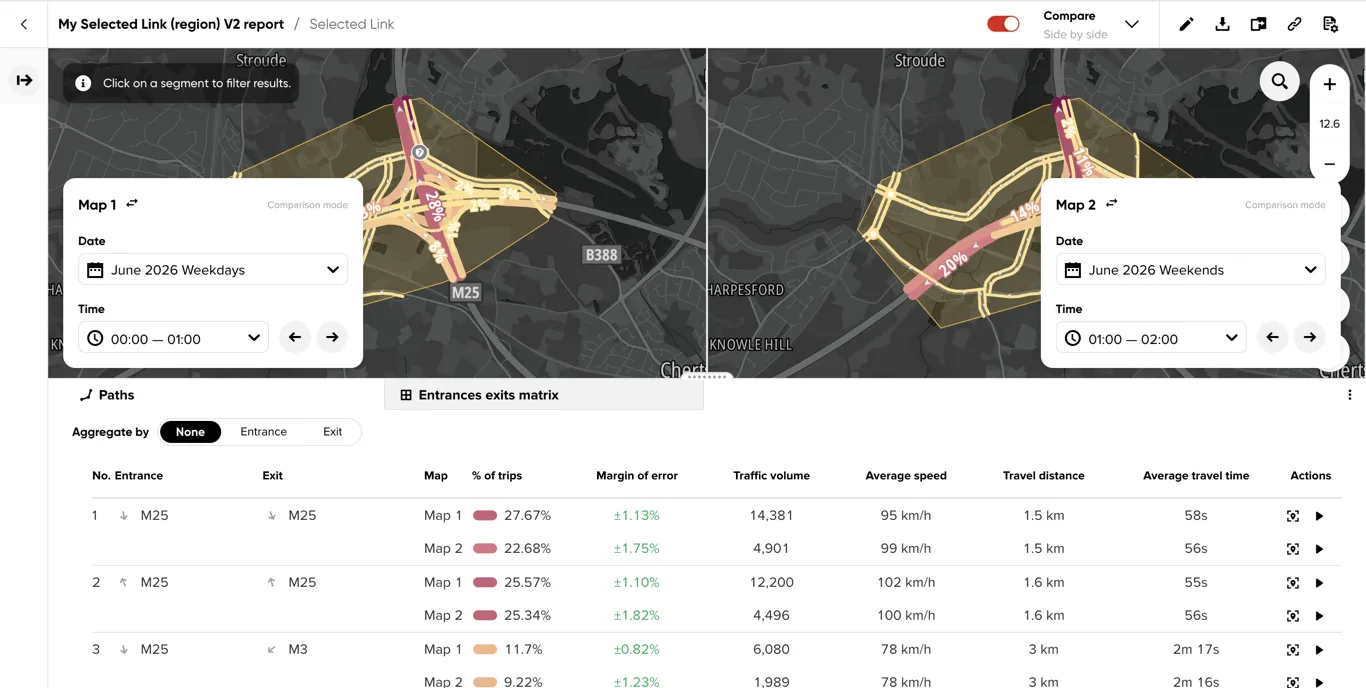
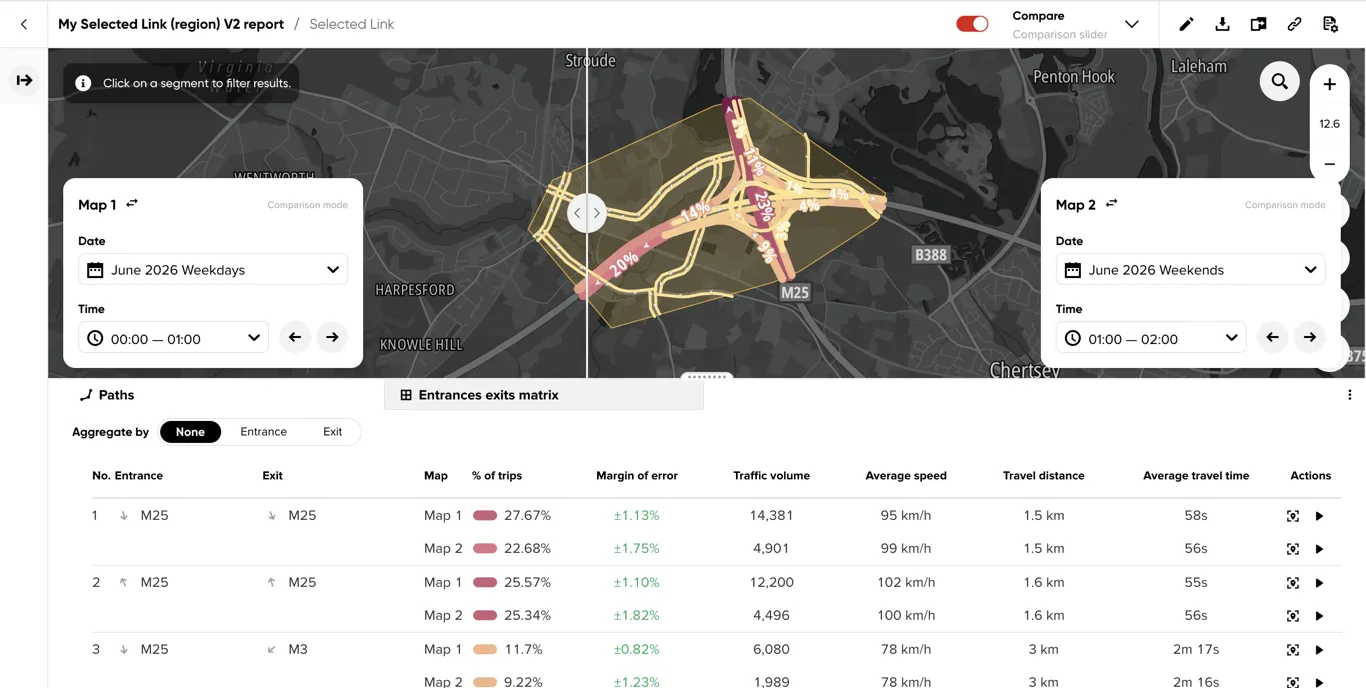
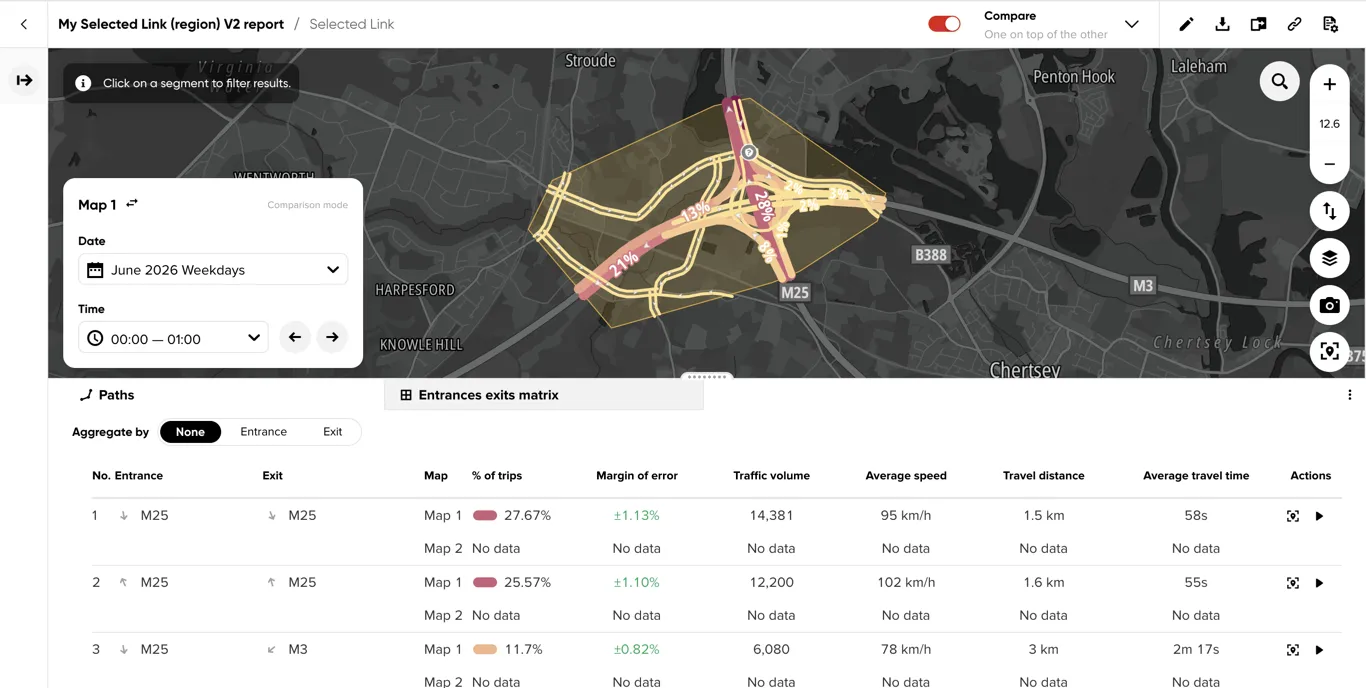
The Entrances exits matrix displays one comparison period at a time. Use its Map 1 / Map 2 selector to switch the values represented by the cells without leaving Compare mode.